Login to Ask a Question or Reply
Home › Forums › Chart Support › Emtpy charts › Reply To: Emtpy charts
June 14, 2021 at 7:00 pm
#34626
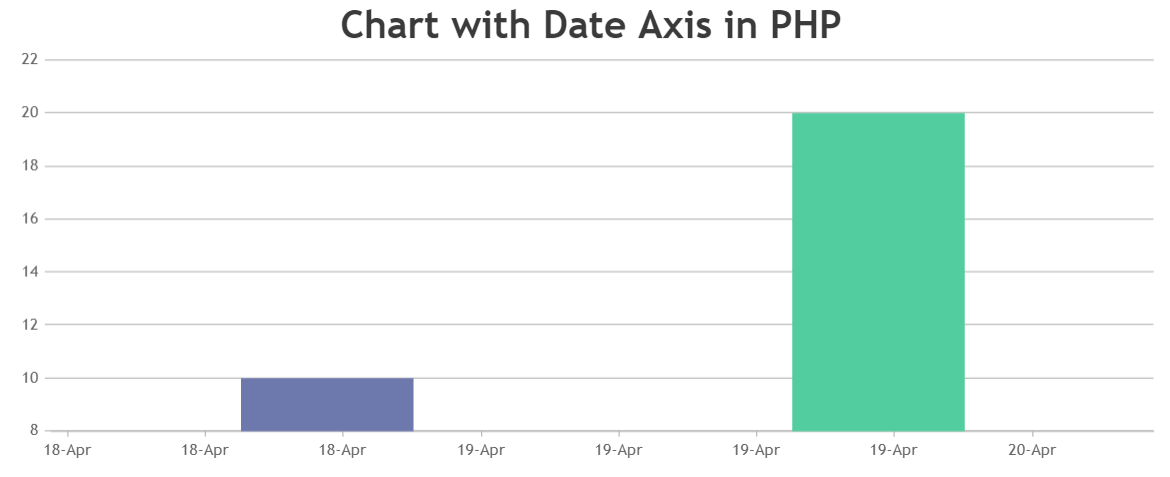
It seems like you are passing the date-time string to dataPoints. To display the chart containing date-time value in PHP, you need to first convert date-time string to PHP timestamp using strtotime(). Later convert PHP timestamp value to javascript timestamp and assign that value to dataPoint x-value in the following format –
[x]=> (strtotime(“2021-06-11 15:51:38”)*1000)
Please take a look at this sample project for an example on rendering the chart in PHP using date-time values data from database.

—-
Manoj Mohan
Team CanvasJS