Login to Ask a Question or Reply
Home › Forums › Chart Support › Multi-Series with different X axis values › Reply To: Multi-Series with different X axis values
June 2, 2021 at 11:05 pm
#34503
When the x-values passed are date-time, labels will be rendered at every interval based on the value of intervalType (For example: if interval is 1, intervalType is ‘month’ – labels will be shown at every 1 month).
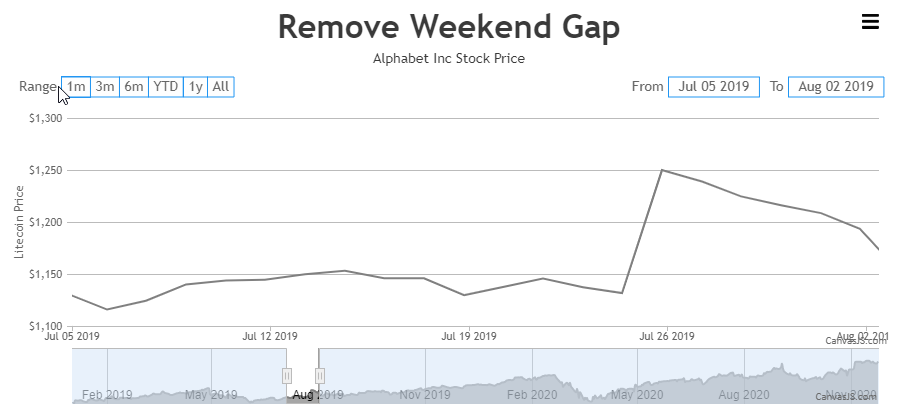
In your case, where you want to show only working days, you can use label instead of x.
Alternatively, you can use scaleBreaks to remove the gap of the weekend as shown in the code-snippet below,
function removeWeekendGap(stockChart) {
  var scaleBreaks = [], dps = stockChart.charts[0].data[0].dataPoints;
  for(var i = 1; i < dps.length; i++) {
    if(dps[i].x.getDate() - 1 != dps[i-1].x.getDate())
      scaleBreaks.push({startValue: new Date(dps[i - 1].x.getTime() + (12 * 60 * 60 * 1000)), endValue: new Date(dps[i].x.getTime() - (12 * 60 * 60 * 1000))});
  }

  stockChart.options.charts[0].axisX.scaleBreaks.customBreaks = scaleBreaks;
  stockChart.render();
}
Please take a look at this JSFiddle for an example on removing the weekend gap.
—
Adithya Menon
Team CanvasJS