Login to Ask a Question or Reply
Home › Forums › Chart Support › Find max peak on spline chart › Reply To: Find max peak on spline chart
June 2, 2021 at 7:05 pm
#34501
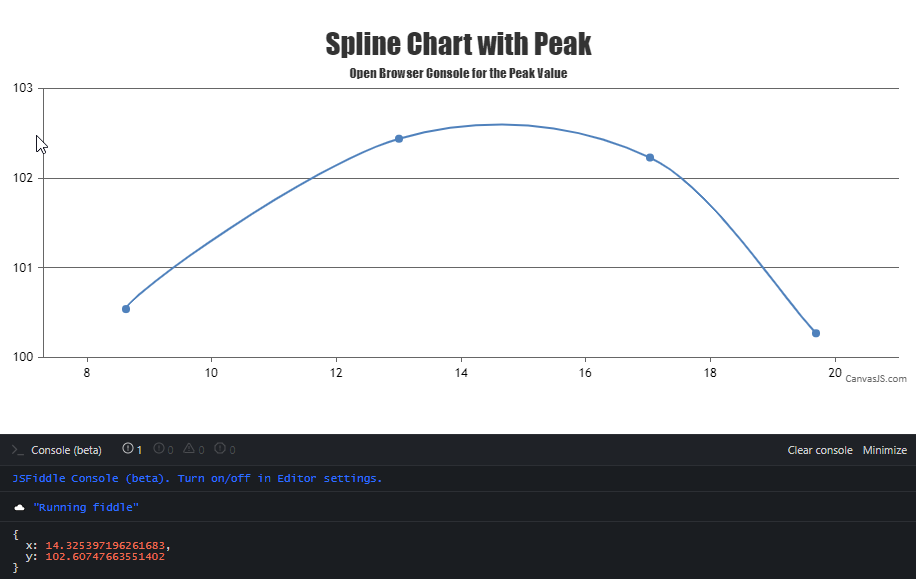
CanvasJS uses Bézier curve interpolation to represent the curve passing through the given dataPoints. We don’t have any property to find the coordinates of the highest / lowest peak as of now. However, you can achieve the same by getting the image from the rendered chart & processing it to find the colored pixel-coordinate from top to bottom. Later you can use convertPixelToValue to get the value corresponding to the pixel-coordinate as shown in the code-snippet below,
var imageData = chart1.ctx.getImageData(chart1.plotArea.x1, chart1.plotArea.y1, chart1.plotArea.width, chart1.plotArea.height).data;

coloredRegionData = [];
for (var i = 0; i < imageData.length; i += 4) {
    if (i % (4 * chart1.plotArea.width) === 0) {
      coloredRegionData.push([]);
      temp = i;
    }
    if (imageData[i] === 255 && imageData[i+1] === 0) {
      coloredRegionData[coloredRegionData.length - 1].push((i - temp) / 4);
    }
}

splinePixelCordinates = [];
for (var i = 0; i < coloredRegionData.length; i++) {
    for (j = 0; j < coloredRegionData[i].length; j++) {
      splinePixelCordinates.push({
        x: chart1.plotArea.x1 + coloredRegionData[i][j],
        y: chart1.plotArea.y1 + i
      })
    }
}
Please take a look at this JSFiddle for an example on finding the coordinates of the highest / lowest peak.
—
Adithya Menon
Team CanvasJS