@benove,
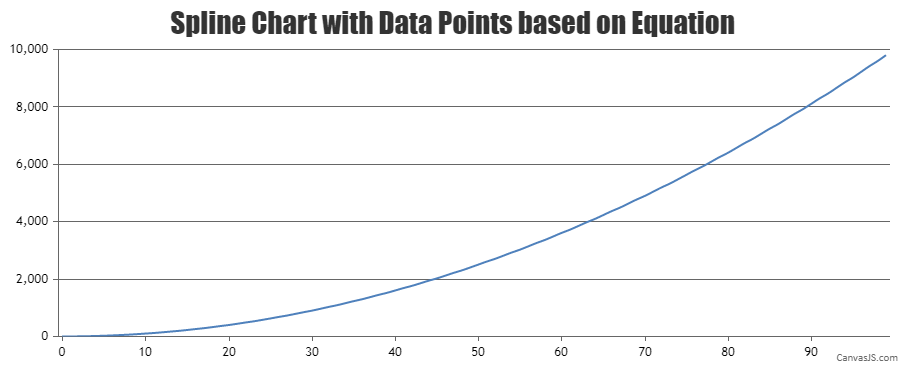
You can generate the dataPoints(x and y-values) based on your formula and render the chart using same. Please check out the below code snippet for generating chart dataPoints using formula –
for (var j = 0; j < dataLength; j++) {
  xVal = j;
  yVal = Math.pow(xVal,2) +  1;
  dps.push({
    x: xVal,
    y: yVal
  });
}
Please take a look at this JSFiddle for a working example.
___________
Indranil Deo
Team CanvasJS