Login to Ask a Question or Reply
Home › Forums › Chart Support › PLOT Graph using txt › Reply To: PLOT Graph using txt
April 28, 2021 at 7:01 pm
#34162
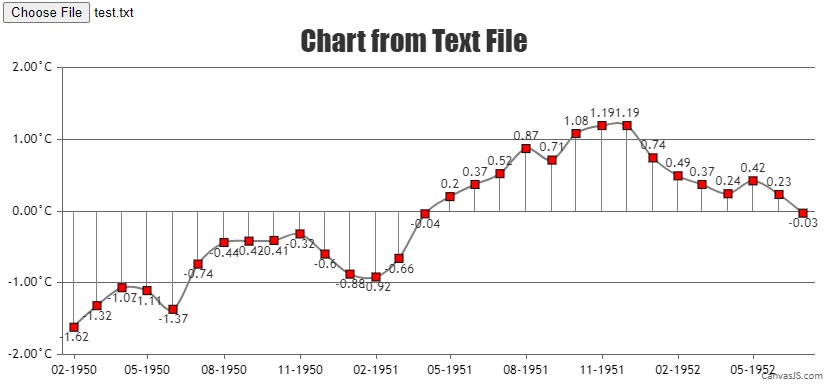
You need to parse the text file to the format accepted by CanvasJS. Please take a look at this below code snippet for the same.
function handleFiles() {
  var fileList = this.files;
  var reader = new FileReader();

  reader.readAsText(fileList[0]);
  reader.onload = function() {
    renderChart(reader);
  }

}

function renderChart(reader) {
  var dpsList = reader.result;
  var dataPoint;
  var dps1= [], dps2 = [], dps3 = [];

  dpsList = dpsList.split("\n");

  for(var i = 1; i < dpsList.length; i++) {
  	var separateData = dpsList[i].split(" ");
  	yVal = parseFloat(separateData[4]);
        xVal = new Date(parseInt(separateData[0]), parseInt(separateData[1]));

    chart.options.data[0].dataPoints.push({x: xVal, y: yVal});
    chart.options.data[1].dataPoints.push({x: xVal, y: yVal});
  }

  chart.render();
}
Also, check out this JSFiddle for complete working code.
—-
Manoj Mohan
Team CanvasJS