Login to Ask a Question or Reply
Home › Forums › Chart Support › Time axis with valueFormatString not working › Reply To: Time axis with valueFormatString not working
April 23, 2021 at 5:27 am
#34078
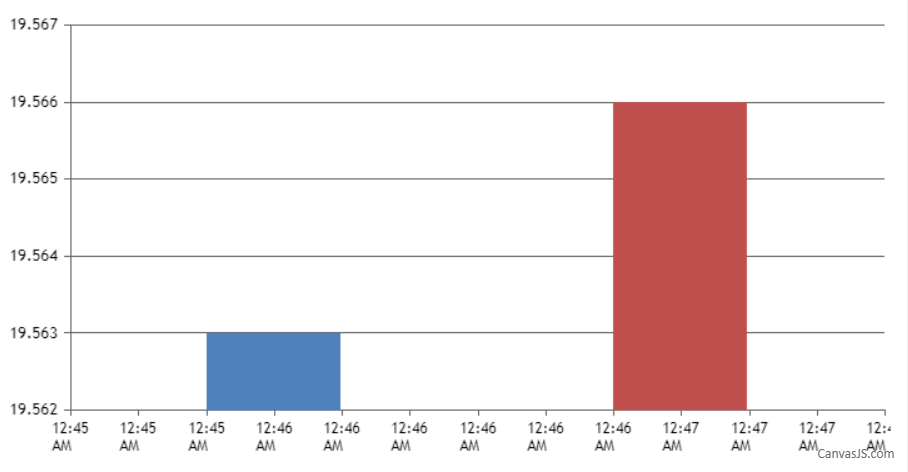
valueFormatString sets how values must be formatted before they appear on Axis X and it is not applied for dataPoints label property. In your case, you can set the xValueType to dateTime for displaying date-time using the timestamp provided in x-value and format the same using valueFormatString as shown in the code snippet below –
axisX: {
  valueFormatString: "hh:mm TT"
},
data: [{
  xValueType: "dateTime",
  dataPoints: [
    {
      x: 1619032560000,
      //label:"Apr-22-2021 00:46",
      y: 19.563,
    }, {
      x: 1619032620000,
      //label: "Apr-22-2021 00:47",
      y: 19.566,
    }
  ],
}
]
Also, please take a look at this JSFiddle for a working example.
___________
Indranil Deo
Team CanvasJS