@ravidasari,
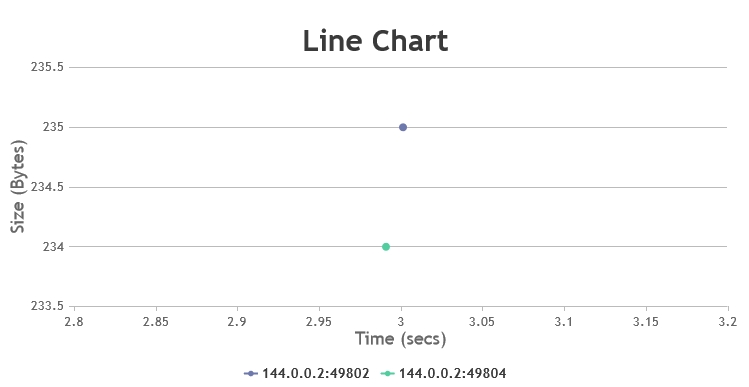
Sorry for the inconvenience caused. There seems to be issue with axis-range when there are less number of datapoints (1 datapoint in 2 dataseries in this case). As we were busy working on some other important features, we were unable to fix this. We will prioritize and fix it in future versions. Meantime you can get it worked by setting minimum & maximum manually. Please find the code-snippet below.
Please take a look at this JSFiddle for complete code.
—
Vishwas R
Team CanvasJS