Login to Ask a Question or Reply
Home › Forums › Chart Support › Time showing issue in Combination of Range and line chart › Reply To: Time showing issue in Combination of Range and line chart
April 19, 2021 at 6:40 pm
#34013
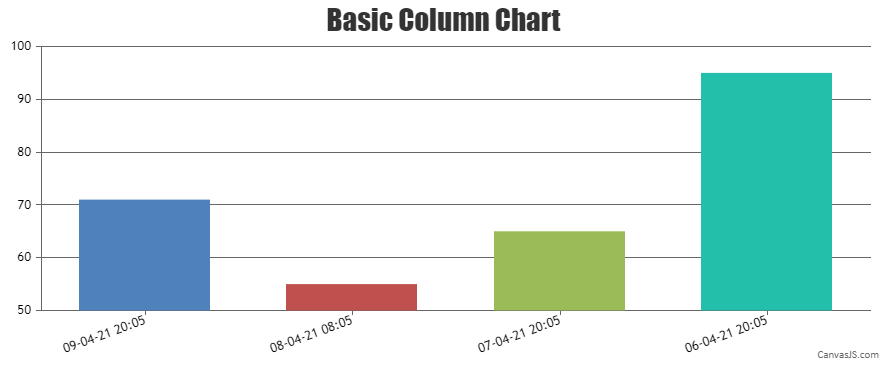
Labels are rendered at every interval on the axis and not to every dataPoint. However, if you like to show labels to dataPoint, you can use label property instead of x-value as shown in the code snippet below –
data: [{
  dataPoints: [
    { label: CanvasJS.formatDate(new Date('2021-04-09T20:05:25.000+05:30'), "DD-MM-YY HH:mm"), y: 71 },
    { label: CanvasJS.formatDate(new Date('2021-04-08T08:05:25.000+05:30'), "DD-MM-YY HH:mm"), y: 55 },
    { label: CanvasJS.formatDate(new Date('2021-04-07T20:05:25.000+05:30'), "DD-MM-YY HH:mm"), y: 65 },
    { label: CanvasJS.formatDate(new Date('2021-04-06T20:05:25.000+05:30'), "DD-MM-YY HH:mm"), y: 95 },
  ]
}]
Also, please take a look at this JSFiddle for complete working code.
___________
Indranil Deo
Team CanvasJS