Login to Ask a Question or Reply
Home › Forums › Chart Support › Help to dynamically bind the stripline to the diagram! › Reply To: Help to dynamically bind the stripline to the diagram!
April 5, 2021 at 7:42 pm
#33865
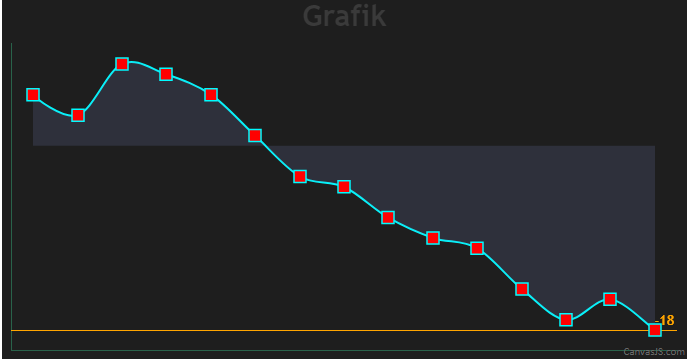
You can create a dynamic stripLine by adding a stripLine and then updating its value and label property to the subsequent y-value of the latest dataPoints which have been added dynamically.
Please take a look at the code snippet below,
function updateChart() {
  $.getJSON("https://canvasjs.com/services/data/datapoints.php?xstart=" + (dataPoints.length + 1) + "&ystart=" + (dataPoints[dataPoints.length - 1].y) + "&length=1&type=json", function(data) {
    $.each(data, function(key, value) {
      dataPoints.push({
        x: parseInt(value[0]),
        y: parseInt(value[1])
      });
      chart.options.axisY.stripLines[0].value = value[1];
      chart.options.axisY.stripLines[0].label = value[1];
    });
    chart.render();
    setTimeout(function(){updateChart()}, 1000);
  });
}
Also, kindly take a look at this JSFiddle for an example to create a dynamic stripLine.
—
Adithya Menon
Team CanvasJS