@ashu-sharma,
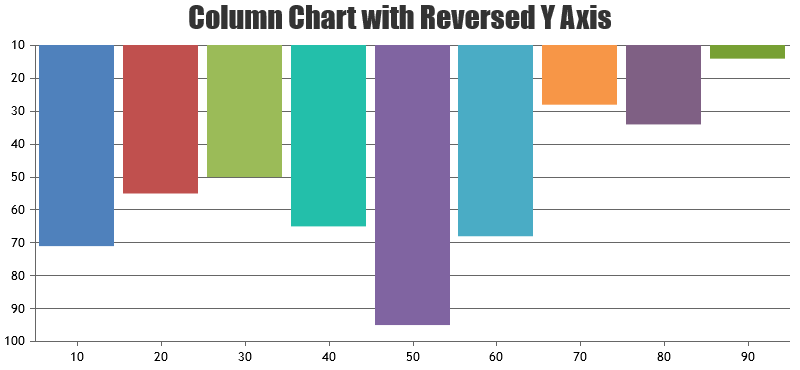
You can set custom range to axis by setting minimum & maximum. Based on the image that you have shared, you can use reversed axis to show negative values towards top & positive towards bottom. Below is the code-snippet to set y-axis range from -10 to 120.
axisY: {
    reversed: true,
    minimum: -10,
    maximum: 120
}
—
Vishwas R
Team CanvasJS