Login to Ask a Question or Reply
Home › Forums › Chart Support › Tooltip multiline chart › Reply To: Tooltip multiline chart
March 15, 2021 at 9:26 pm
#33251
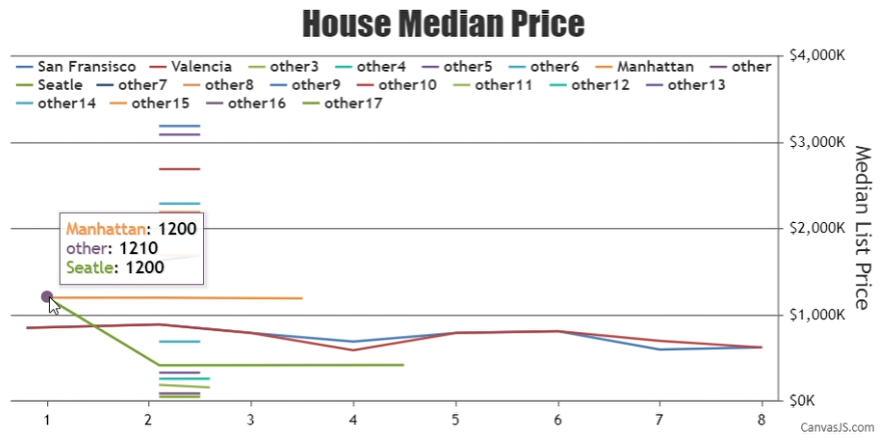
You can show the dataPoints that are close to each other by selecting the dataPoints that fall within a specific range to the mouse pointer position. You can define the range by setting the following variables –
var yRange = 100;
var xRange = 10;
Then inside the toolTip contentFormatter you can display the dataPoints that fall within the given range as shown below –
toolTip: {
  contentFormatter: function(e){
    var content = "", dataPoint;
    toolTipXValue = e.entries[0].dataPoint.x;
    toolTipYValue = e.entries[0].dataPoint.y;

    for (var i = 0; i < e.chart.data.length; i++) {
      dataPoint = e.chart.data[i].dataPoints[e.entries[0].index];
      if(dataPoint && (toolTipYValue - yRange) <= dataPoint.y && dataPoint.y <= (toolTipYValue + yRange) && (toolTipXValue - xRange) <= dataPoint.x && dataPoint.x <= (toolTipXValue + xRange)){
        content += "<span style='color:" + e.chart.selectedColorSet[i] + "'>" + e.chart.data[i].name + "</span>: " + "<strong>" + dataPoint.y + "</strong>";
        content += "<br/>";
      }
    }
    return content;
  }
},
Please take a look at this JSFiddle for the complete code.
___________
Indranil Deo
Team CanvasJS