Login to Ask a Question or Reply
Home › Forums › Chart Support › dateTime stamp time zone › Reply To: dateTime stamp time zone
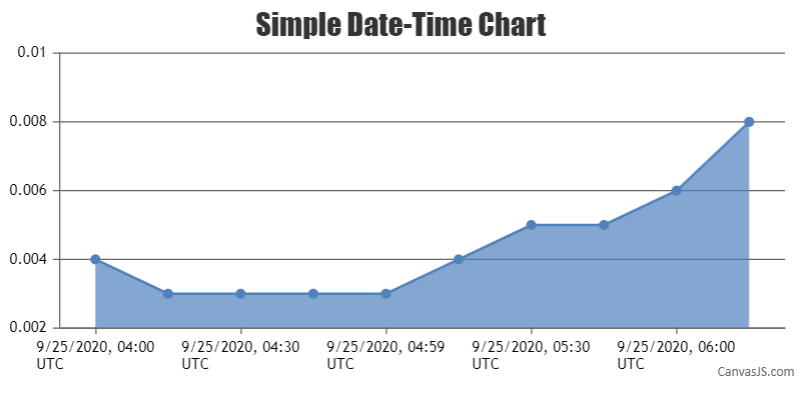
When we use the x-values for dataPoint, axis Labels are not shown for dataPoint but at every interval of the axis. As you are looking to display axis label at specified dataPoint value using label property in dataPoint along with the x-value should work fine.
To achieve this, you can pass a custom attribute(for example, "time") that will store timestamp values to each dataPoint object. The initial options to dataPoints array will be like:
[
  {
    "time": 1601006400003,
    "y": 0.004
  },
  {
    "time": 1601007299997,
    "y": 0.003
  },
  {
    "time": 1601008200000,
    "y": 0.003
  }
]
Just before rendering the chart, we will add the label property with timestamp value converted to UTC and x-value with average offset value between subsequent timestamps(x-values are used here for setting interval). Below is the code snippet for achieving the same:
let date = new Date(dataPoints[i].time);
dataPoints[i].label = date.toLocaleDateString("en-US", localeOptions);
dataPoints[i].x = i * 15; //15 minutes is average difference between timestamp values
You can also refer to this update JSFiddle for a working example with sample code.
—
Shashi Ranjan
Team CanvasJS