Login to Ask a Question or Reply
Home › Forums › Chart Support › grid lines in between each datapoint in a bar chart › Reply To: grid lines in between each datapoint in a bar chart
March 12, 2021 at 7:07 pm
#33234
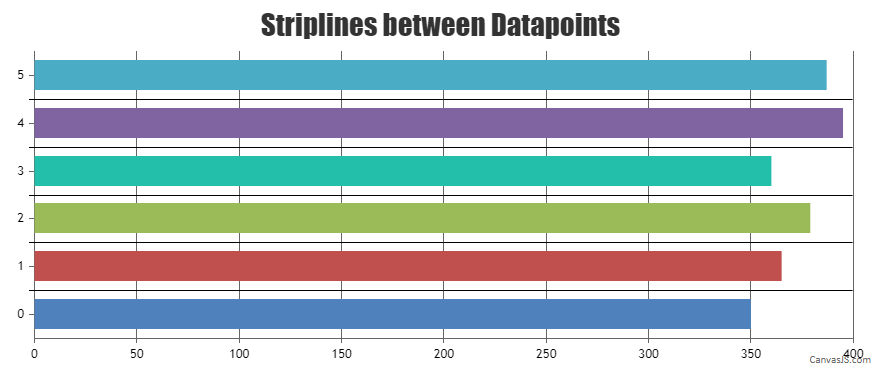
It is possible to add a line between each dataPoint using stripLines. You can dynamically calculate the value between the dataPoints to find the value where stripline has to be added. Please take a look at the code snippet below,
function addStripLines() {
  var dataPoints  = chart.options.data[0].dataPoints;

  for(var i = 1; i < dataPoints.length; i++) {
    chart.axisX[0].addTo("stripLines", {
      value: dataPoints[i].x - (dataPoints[i].x - dataPoints[i-1].x) / 2,
      showOnTop: true,
      color: "black",
      thickness: 1,
      labelPlacement: "outside"
    }, false)
  }

  chart.render();
}
Kindly take a look at this JSFiddle for an example on creating Striplines inbetween Datapoints.
—
Adithya Menon
Team CanvasJS