Login to Ask a Question or Reply
Home › Forums › Chart Support › Any way to remove the “Y” values from the chart? › Reply To: Any way to remove the “Y” values from the chart?
March 5, 2021 at 7:23 pm
#32995
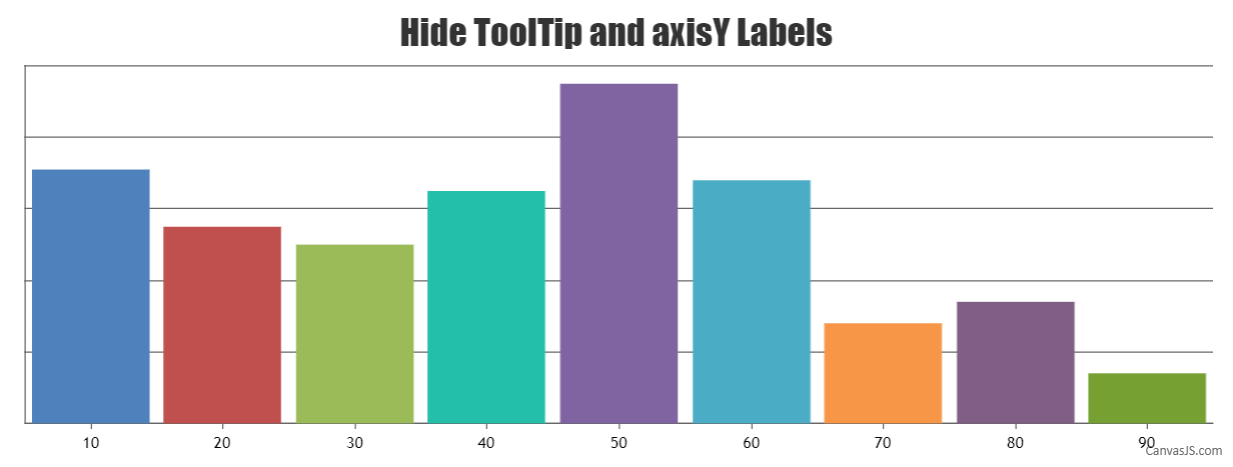
If you like to disable interactivity with the chart (i.e. dataPoint highlight, toolTip, touch, and mouse events) you can set interactivityEnabled: false. However, if you want to highlight the dataPoint and just hide the toolTip you can disable it using enabled property as shown in the code below –
toolTip:{
   enabled: false,
 }
To hide the y-axis labels and ticks you can return an empty string inside labelFormatter and set tickThickness to 0 as shown below –
axisY: {
  tickThickness: 0,
    labelFormatter: function(e) {
      return "";
    }
},
Also, kindly take a look at this JSFiddle for an example on hiding toolTip and y-axis labels.
___________
Indranil Deo
Team CanvasJS