Login to Ask a Question or Reply
Home › Forums › StockChart Support › Pragmatically get axisX.stripLines label › Reply To: Pragmatically get axisX.stripLines label
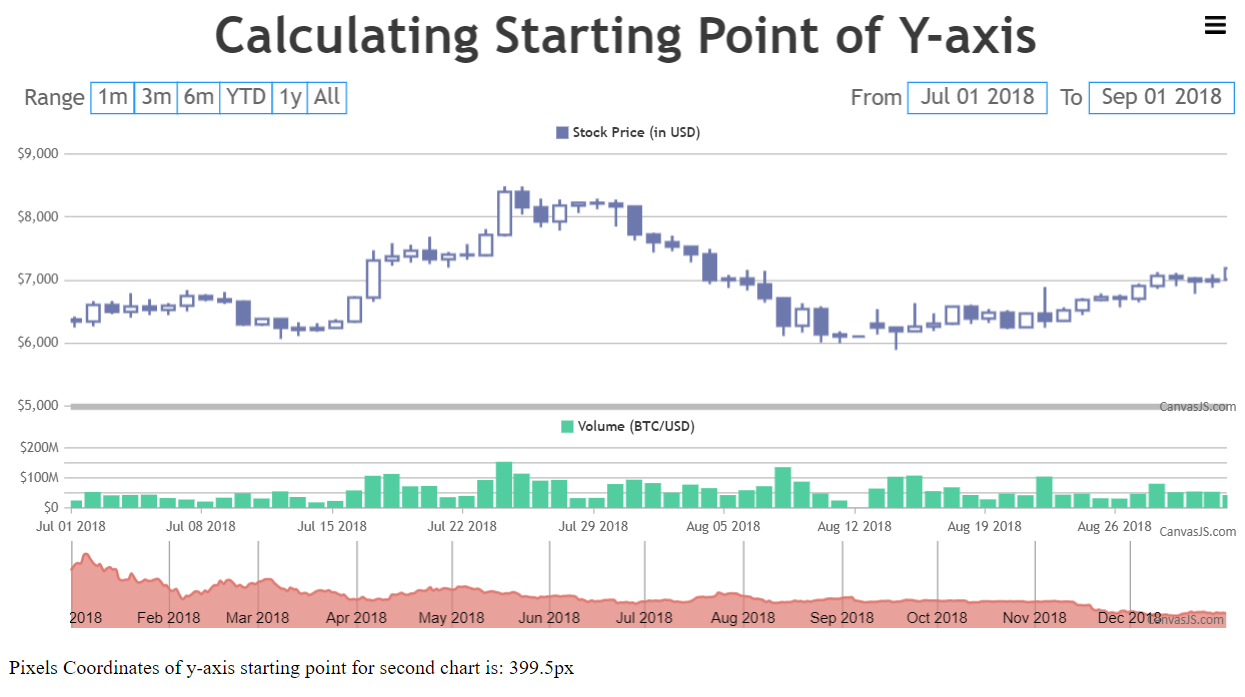
In the code sample shared by you, the offsetTop value of chartContainer is added to the pixel coordinate of the axisY. The chartContainer contains the complete stockChart. Hence, to calculate the pixel coordinate of y-axis for a specific chart you need to add the offsetTop value of the chart with the pixel coordinate of the axisY as shown below –
stockChart.charts[1].container.offsetTop + stockChart.charts[1].axisY[0].convertValueToPixel(stockChart.charts[1].axisY[0].viewportMinimum)
Also, kindly take a look at this JSFiddle for an example on calculating the starting/bottom point of y-axis.
___________
Indranil Deo
Team CanvasJS