@hmike0878,
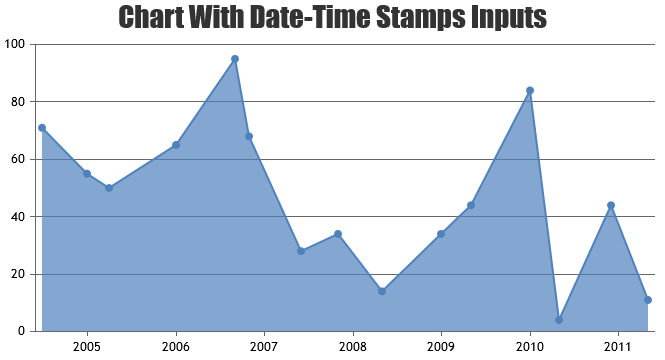
Datapoints supports both numeric and date-time for x-values. You can either pass date-time values as date object or timestamp. If you are passing x-values as timestamp, you will have to set xValueType to ‘dateTime’ – xValueType: "dateTime". Please take a look at this documentation page for tutorial on using date-time values in chart along with examples that you can try out or download from the editor.
—
Vishwas R