Login to Ask a Question or Reply
Home › Forums › Chart Support › How to dynamically display two differents dates in the X axis? › Reply To: How to dynamically display two differents dates in the X axis?
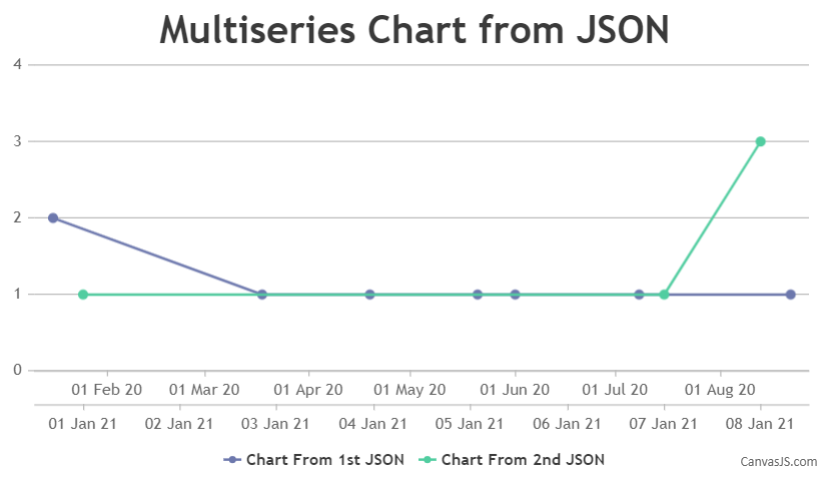
Creating a chart with two dataSeries(of type line) is definitely possible with CanvasJS and this concept is known as multiseries chart. In this scenario, you just have to make two AJAX call in an order(one after the other), parse the data in the format accepted by CanvasJS for the respective dataSeries and call render method. To make sure that both the APIs are called in an order, you can perform jQuery.getJSON() method inside jQuery.when() and .then() method. Code snippet below shows how this can be achieved:
$.when($.getJSON("https://api.npoint.io/eef1138dc72b4ac725d2", function(data){
  for (var i = 0; i < data.length; i++) {
    dataPoints1.push({
      x: new Date(data[i].partialDate),
      y: data[i].partialCount
    });
  }
})).then(function(){
  $.getJSON("https://api.npoint.io/4eba2d1dbcc0c16e5bcc", function(data){
    for (var i = 0; i < data.length; i++) {
      dataPoints2.push({
        x: new Date(data[i].partialDate),
        y: data[i].partialCount
      });
    }
    chart.render();
  })
})
You can also set axisXIndex for a respective dataSeries in order to have a seperate X-Axis for it. Please take a look at this JSFiddle for an example on the same.
—
Shashi Ranjan
Team CanvasJS