Login to Ask a Question or Reply
Home › Forums › Chart Support › using json array from php json_encode › Reply To: using json array from php json_encode
Thank you for sharing the sample project.
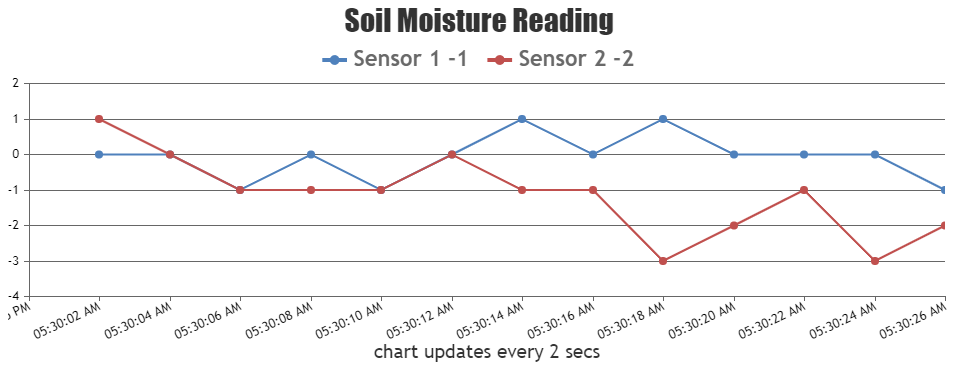
– x axis will be Date value
– y axis will be sensor value
In order to create a chart with date and time axis, you can parse the x-values are date objects and y-value as a number as shown below:
var sensor1 = <?php echo json_encode($json_sensor1, JSON_NUMERIC_CHECK); ?>;
var sensor2 = <?php echo json_encode($json_sensor2, JSON_NUMERIC_CHECK); ?>;
var dataPoints1 = [], dataPoints2 = [];
for(var i = 0; i < sensor1.length; i++){
	dataPoints1.push({ x: new Date(sensor1[i].Date), y: Number(sensor1[i].sensorValue)});
}
for(var i = 0; i < sensor2.length; i++){
	dataPoints2.push({ x: new Date(sensor2[i].Date), y: Number(sensor2[i].sensorValue)});
}
– plot only the latest 50 data points
– update the graph every 5 seconds and only showing 50 data points
If you don’t want the dataPoints to keep getting accumulated, you can remove old values from the beginning of the Array before the chart is rendered. This process of getting new value from sensors and rendering the chart with those can be repeated every 5 seconds as shown below:
setInterval(function(){updateChart()}, updateInterval);

function updateChart() {
  xValue = dataPoints1[dataPoints1.length - 1].x.getTime();
  var deltaY1, deltaY2;
  xValue += updateInterval;
  // adding random value
  yValue1 += Math.round(2 + Math.random() *(-2-2));
  yValue2 += Math.round(2 + Math.random() *(-2-2));

  // pushing the new values
  dataPoints1.push({
    x: new Date(xValue),
    y: yValue1
  });
  sensor2.push({
    x: new Date(xValue),
    y: yValue2
  });

  if(dataPoints1.length > 50){
    dataPoints1.shift();
  }
  if(dataPoints2.length > 50){
    dataPoints2.shift();
  }
  // updating legend text with  updated with y Value
  chart.options.data[0].legendText = "Sensor 1 " + yValue1;
  chart.options.data[1].legendText = " Sensor 2 " + yValue2;
  chart.render();
}
Please take a look at this updated sample project for a working example with sample code.
—
Shashi Ranjan
Team CanvasJS