Login to Ask a Question or Reply
Home › Forums › Chart Support › canvasjs with python Flask › Reply To: canvasjs with python Flask
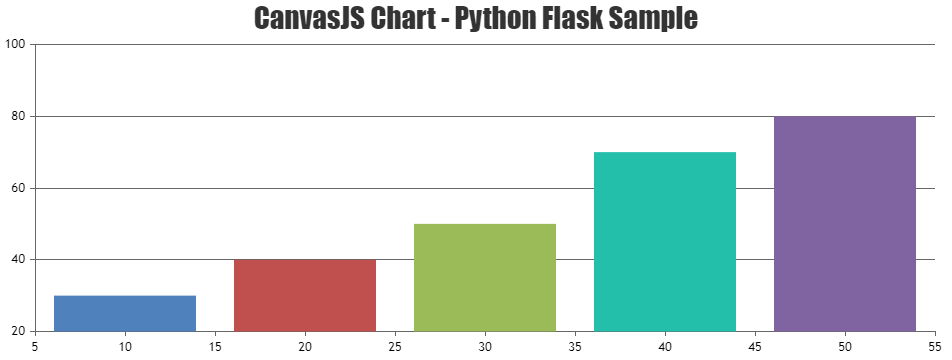
As per the code snippet shared above, it looks like you are passing x-value as string in a dataPoint, whereas x-value can either be a numeric value or a dateTime value. Here is how you can make modify your index.html file:
<html>
    <head>
        <meta name="viewport" content="width=device-width, initial-scale=1.0">
        <meta http-equiv="Content-Type" content="text/html; charset=utf-8" />
        <title>CanvasJS Chart Python Flask Sample</title>
        <script type="text/javascript" src="https://cdn.canvasjs.com/canvasjs.min.js"></script>
        <script type="text/javascript">
            window.onload = function() {
                var dps = [
                            {% for key,value in data.items() %}
                                { x: {{key}}, y: {{value}} },
                            {% endfor %}
                ];
                var chart = new CanvasJS.Chart("chartContainer", {
                    title:{
                        text: "CanvasJS Chart Python Flask Sample"
                    },
                    data: [
                    {
                        // Change type to "doughnut", "line", "splineArea", etc.
                        type: "column",
                        dataPoints: dps
                    }
                    ]
                });
                chart.render();
            }
        </script>
        <style type="text/css">
        </style>
    </head>
    <body>
        <div id="chartContainer" style="width: 100%; height: 300px;"></div>
    </body>
</html>
You can also take look at this sample project for a working example with sample code on the integration of CanvasJS with python flask.
If you are still facing the issue in integrating CanvasJS charts with python flask, kindly create a sample project reproducing the issue you are facing and share it with us(along with sample data) over Google-Drive or Onedrive so that we can run the sample locally at our end to understand the scenario better and help you out?
—-
Manoj Mohan
Team CanvasJS