Login to Ask a Question or Reply
Home › Forums › Feature Requests & Feedback › canvasjs with python Flask › Reply To: canvasjs with python Flask
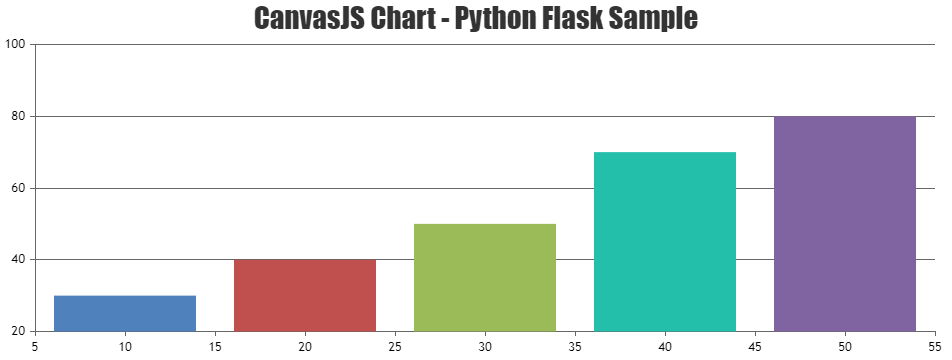
As per the code snippet shared above, it looks like you are passing x-value as string in a dataPoint, whereas x-value can either be a numeric value or a dateTime value. Here is how you can make modify your index.html file:
<html>
    <head>
        <meta name="viewport" content="width=device-width, initial-scale=1.0">
        <meta http-equiv="Content-Type" content="text/html; charset=utf-8" />
        <title>CanvasJS Chart Python Flask Sample</title>
        <script type="text/javascript" src="https://cdn.canvasjs.com/canvasjs.min.js"></script>
        <script type="text/javascript">
            window.onload = function() {
                var dps = [
                            {% for key,value in data.items() %}
                                { x: {{key}}, y: {{value}} },
                            {% endfor %}
                ];
                var chart = new CanvasJS.Chart("chartContainer", {
                    title:{
                        text: "CanvasJS Chart Python Flask Sample"
                    },
                    data: [
                    {
                        // Change type to "doughnut", "line", "splineArea", etc.
                        type: "column",
                        dataPoints: dps
                    }
                    ]
                });
                chart.render();
            }
        </script>
        <style type="text/css">
        </style>
    </head>
    <body>
        <div id="chartContainer" style="width: 100%; height: 300px;"></div>
    </body>
</html>
You can also take look at this sample project for a working example with sample code on the integration of CanvasJS with python flask.
If you are still facing the issue in integrating CanvasJS charts with python flask, kindly create a sample project reproducing the issue you are facing and share it with us(along with sample data) over Google-Drive or Onedrive so that we can run the sample locally at our end to understand the scenario better and help you out?
Considering this as duplicate of CanvasJS with Python Flask. Hence closing the same.
—
Shashi Ranjan
Team CanvasJS