@driven13,
You can change the color of any datapoint by setting color property. Please refer documentation for more information along with live example.
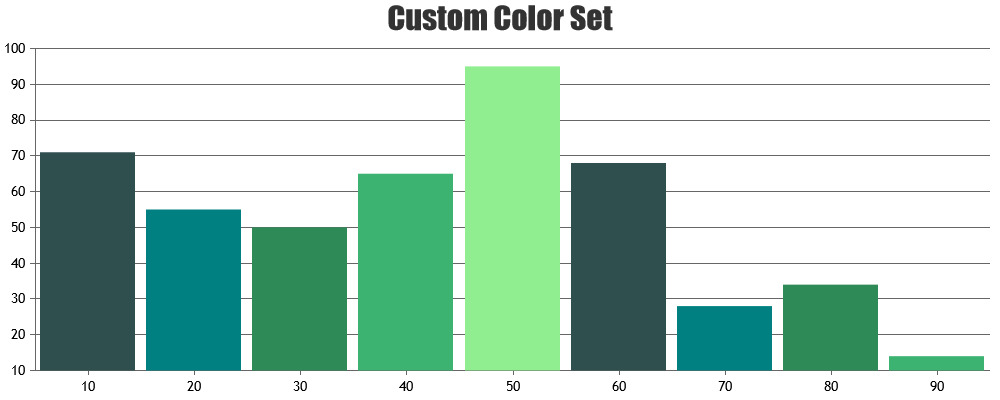
You can also have custom color-set in the chart, please refer documentation for more information.
—
Vishwas R
Team CanvasJS
