@driven13,
Setting label along with x and y-values should work fine in this case.
Kindly take a look at the code snippet below,
data: [{
type: "spline",
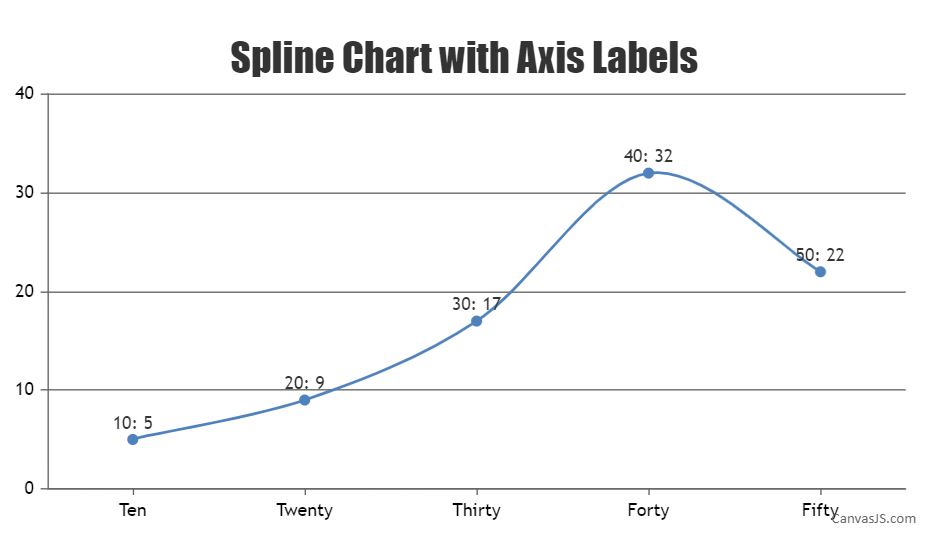
indexLabel: "{x}: {y}",
dataPoints: [
{ x: 10, y: 5, label: "Ten" },
{ x: 20, y: 9, label: "Twenty" },
{ x: 30, y: 17, label: "Thirty" },
{ x: 40, y: 32, label: "Forty" },
{ x: 50, y: 22, label: "Fifty" }
]
}]
Please take a look at this JSFiddle for an example on spline charts with axis labels.
—
Vishwas R
Team CanvasJS