@yansonalvin97,
Parsing the dataPoints to the format accepted by CanvasJS before passing it to chart-options should work fine in this case.
for (var i = 0; i <= result.length - 1; i++) {
  dataPoints.push({ x: Number(result[i].x), y: Number(result[i].y) });
}
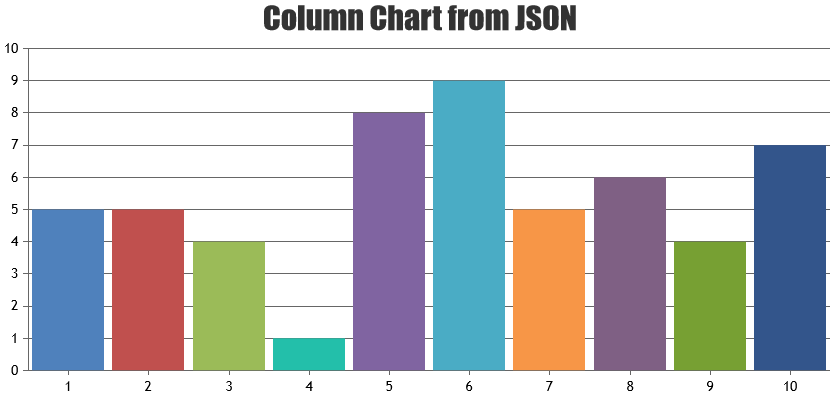
Please take a look at this JSFiddle for rendering chart from JSON object.
If you are still facing issue, kindly share sample project along with sample JSON over Google-Drive or Onedrive, so that we can look into it and help you out.
—
Vishwas R
Team CanvasJS