Login to Ask a Question or Reply
Home › Forums › Chart Support › chart not rendering › Reply To: chart not rendering
February 18, 2019 at 3:58 pm
#24371
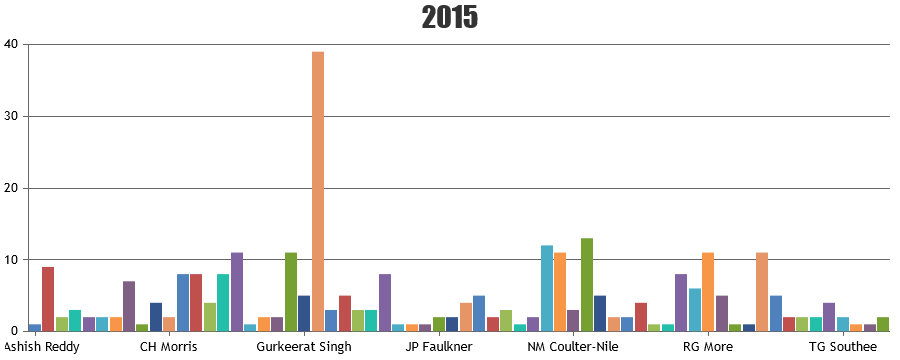
In the code that you have shared, the JSON-format(data and value) doesn’t seems to be proper. Storing names as array of string and values as array of numbers should work fine in this case. Please find the code-snippet for parsing JSON data below.
for(var j = 0; j < probForObj["data"].length; j++){
  dataPoints.push({label: probForObj["data"][j], y: Math.round(probForObj["value"][j])});
}
Please take a look at this JSFiddle for working sample.

—
Vishwas R
Team CanvasJS