Login to Ask a Question or Reply
Home › Forums › Chart Support › How to Re render with animation › Reply To: How to Re render with animation
January 30, 2019 at 6:08 pm
#24169
Guilherme,
Chart animates only on the first render, as of now. When you use set method, chart re-renders based on the 3rd parameter. During the first render, as there are no dataPoints present, animation wouldn’t be visible. During second render (happened because of set method) animation wouldn’t happen.
To update dataPoints dynamically and to animate chart, you can instantiate the chart, update dataPoints via chart-options and then call chart.render as shown in the code snippet below:
var chart = new CanvasJS.Chart("chartContainer", {
title: {
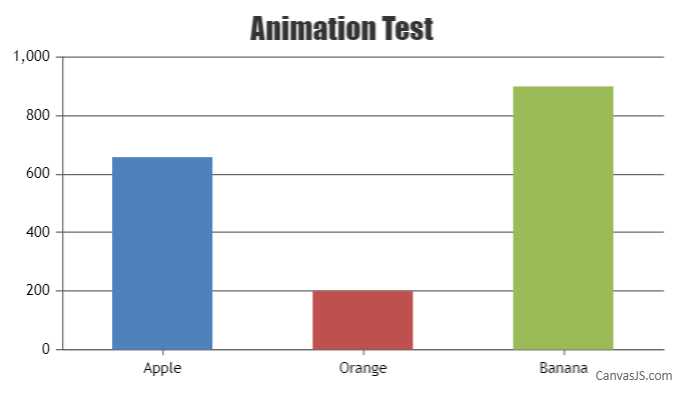
text: "Animation Test"
},
animationEnabled: true,
data: [{
type: "column",
dataPoints: []
}]
});
chart.options.data[0].dataPoints = [{ label: "Apple", y: 658 },
{ label: "Orange", y: 200 },
{ label: "Banana", y: 900 }];
chart.render();Please take a look at this updated JSFiddle for an example with sample code.
—
Vishwas R
Team CanvasJS