Login to Ask a Question or Reply
Home › Forums › Chart Support › multiple charts with dynamic id using angularjs ng-repeat › Reply To: multiple charts with dynamic id using angularjs ng-repeat
January 8, 2019 at 8:45 pm
#23955
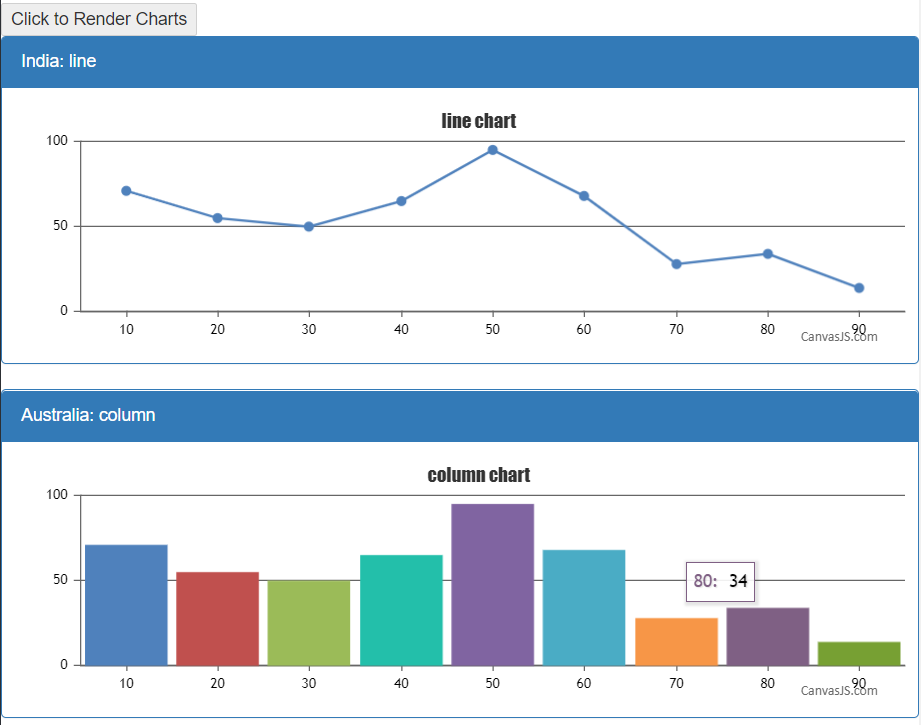
You can use directive to add the required HTML elements and use the same as a container(DIV) for the charts to render on button click. Please check the below code snippet –
HTML
<div ng-controller="chartContainerController">
   <div>
     <button id="renderChart" ng-click="clickMe()">Click to Render Charts</button>
     <div add-containers id="addContainers"></div>
   </div>
</div>
JS
angular.module('myapp', [])
  .controller('chartContainerController', ['$scope', function($scope) {
    $scope.chartContainers = [
      { id: 'chartContainer1', type: 'line', country: 'India' },
      { id: 'chartContainer2', type: 'column', country: 'Australia' },
      { id: 'chartContainer3', type: 'spline', country: 'Canada' },
      { id: 'chartContainer4', type: 'scatter', country: 'USA' }];
  }])
  .directive("addContainers", function($compile){
  return{
    scope:false,
    link:function(scope,element,attributes){
      scope.clickMe= function() {
        $.when(
          angular.element(document.getElementById('addContainers')).append($compile(('<div class="panel panel-primary" ng-repeat="chartContainer in chartContainers"> <div class="panel-heading">{{ chartContainer.country }}: {{chartContainer.type}} </div><div class="panel-body"><div id="{{ chartContainer.id }}" class="container"></div></div></div>'))(scope))).then(function() {
          angular.forEach(scope.chartContainers, function (value, index) {
            var chart = new CanvasJS.Chart(scope.chartContainers[index].id, {
              title: {
                text: scope.chartContainers[index].type +" chart"
              },
              data: [
                {
                  type: scope.chartContainers[index].type,
                  dataPoints: [
                    { x: 10, y: 71 },
                    { x: 20, y: 55 },
                    { x: 30, y: 50 },
                    { x: 40, y: 65 },
                    { x: 50, y: 95 },
                    { x: 60, y: 68 },
                    { x: 70, y: 28 },
                    { x: 80, y: 34 },
                    { x: 90, y: 14 }
                  ]
                }
              ]
            });
            chart.render();
          });
          document.getElementById("renderChart").disabled = true;
        }
      )};
    }
  }
});
Also, kindly take a look at this JSFiddle to render chart on button click in AngularJS.
___________
Indranil Deo
Team CanvasJS