@gurpreet2501,
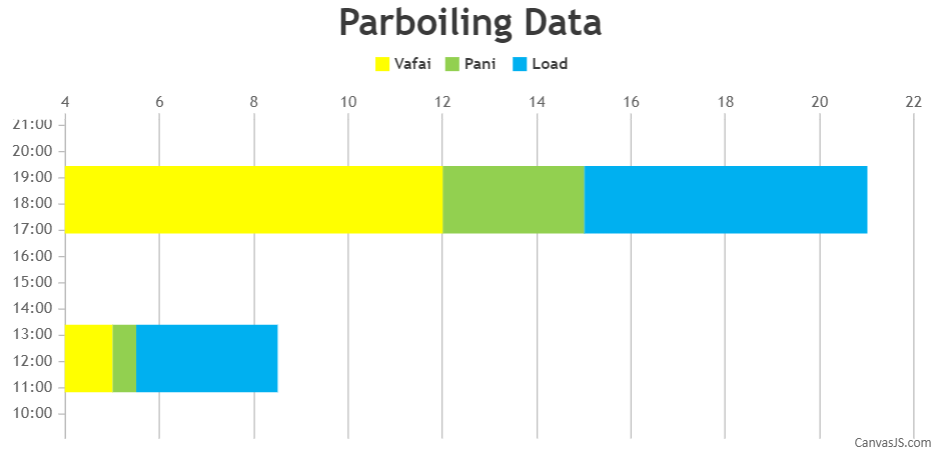
In the code snippet shared above, you’re using label to display date and time value. Instead, you need to assign the Date Object to x-values and set the axisX valueFormatString as valueFormatString: "HH:mm" for displaying time in 24-hour format(using “hh” will display time in 12-hour format).
Also, please take a look at this JSFiddle for a working example with sample code.
__
Shashi Ranjan
Team CanvasJS