Login to Ask a Question or Reply
Home › Forums › Chart Support › how can i get the max, min, avg and current value of any multi series chart › Reply To: how can i get the max, min, avg and current value of any multi series chart
October 22, 2018 at 4:02 pm
#23151
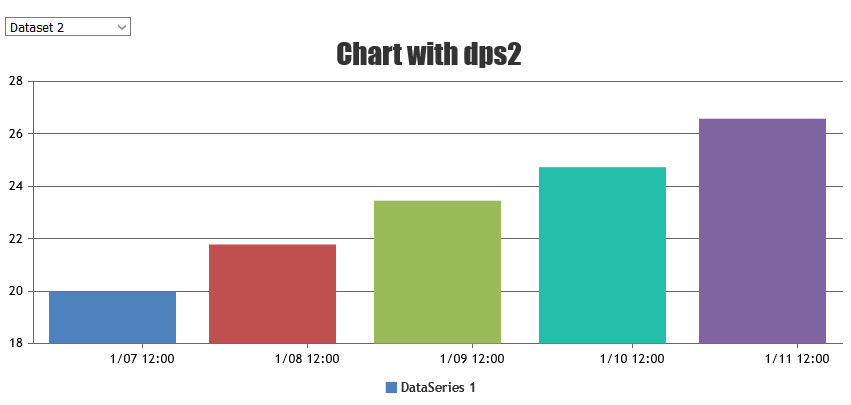
You can render chart with dataPoints based on the values being selected from dropdown using change event. Below is the code-snippet for the same.
$(".dropdown").change(function() {
	chart.options.data[0].dataPoints = [];
  var e = document.getElementById("dd");
	var selected = e.options[e.selectedIndex].value;
  dps = jsonData[selected];
  chart.options.title = { text: "Chart with " + selected };
  for(var i in dps) {
  	var xVal = dps[i].x;
    chart.options.data[0].dataPoints.push({x: new Date(xVal), y: dps[i].y});
  }
  chart.render();
});
Please take a look at this JSFiddle for complete code.
But i am facing an issue, i want to add data series using a multiselect dropdown,
It would be helpful for us to understand your issue better when we look at your code working live in jsfiddle. So I request you to create jsfiddle reproducing the issue and share it with us.
—
Vishwas R
Team CanvasJS