Login to Ask a Question or Reply
Home › Forums › Chart Support › how can i get the max, min, avg and current value of any multi series chart › Reply To: how can i get the max, min, avg and current value of any multi series chart
October 18, 2018 at 6:43 pm
#23114
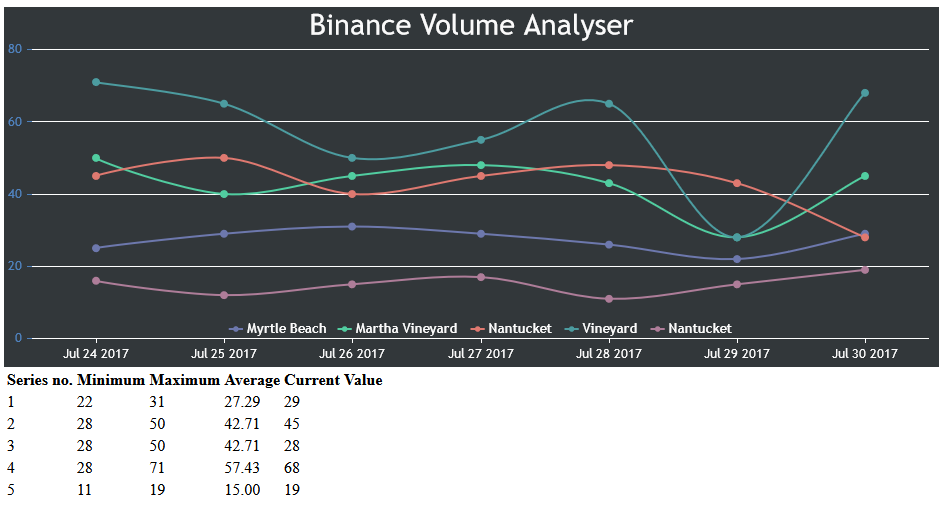
You can loop through dataPoints of all the series to calculate the minimum, maximum & average values. Please find the code snippet below.
function performCalculations(dataPointValue, currentValue, seriesIndex) {
  sum = 0;
  for( var j = 0; j<dataPointValue.length; j++ )
    sum = sum - (-dataPointValue[j]);
  average = sum / dataPointValue.length;
  seriesIndex = seriesIndex + 1;

  $("tr:eq("+seriesIndex+") #td" + 0).html(seriesIndex)
  $("tr:eq("+seriesIndex+") #td" + 1).html(Math.min.apply(null, dataPointValue))
  $("tr:eq("+seriesIndex+") #td" + 2).html(Math.max.apply(null, dataPointValue))
  $("tr:eq("+seriesIndex+") #td" + 3).html(average.toFixed(2))
  $("tr:eq("+seriesIndex+") #td" + 4).html(currentValue)
}
Please take a look at this JSFiddle for complete code.
—
Vishwas R
Team CanvasJS