Login to Ask a Question or Reply
Home › Forums › Chart Support › How to hide the secondary graph but not the axis label › Reply To: How to hide the secondary graph but not the axis label
September 10, 2018 at 10:07 am
#22550
Satyabrata,
I request you to share the JSFiddle to try the steps you have mentioned, the reason being – in the JSFiddle that I had shared earlier, once you click Toggle Button, it hides all the dataSeries after which you can’t zoom into any region as there are no dataPoints available to zoom.
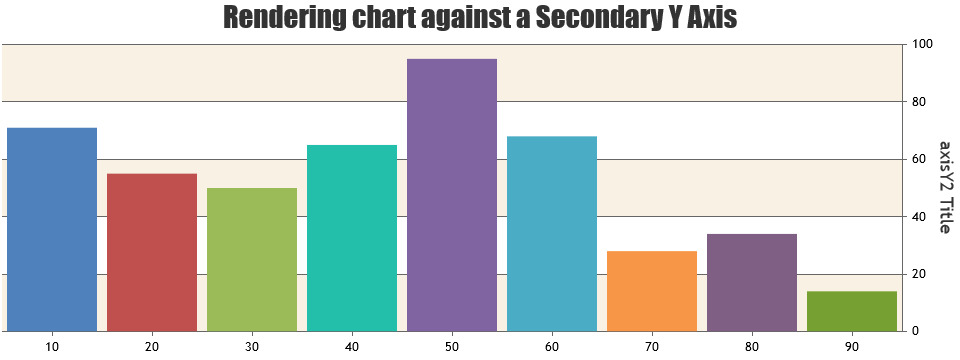
click the toggle button and hide the axisY2 graph but show axisY2 labels.
Do you mean hide dataSeries. Also can you please brief what do you mean by ‘axisY2 graph’ as the entire chart itself is a graph – do you mean the dataSeries that is attached to axisY2.

—
Vishwas R
Team CanvasJS