@d3bsky,
valueFormatString is used to format numbers and date time values (x-values) that appears on axisX but not for labels. Passing x-value to dataPoints should work fine in your case dps.push({"x":new Date(result[i].time), "y":result[i].humidity});.
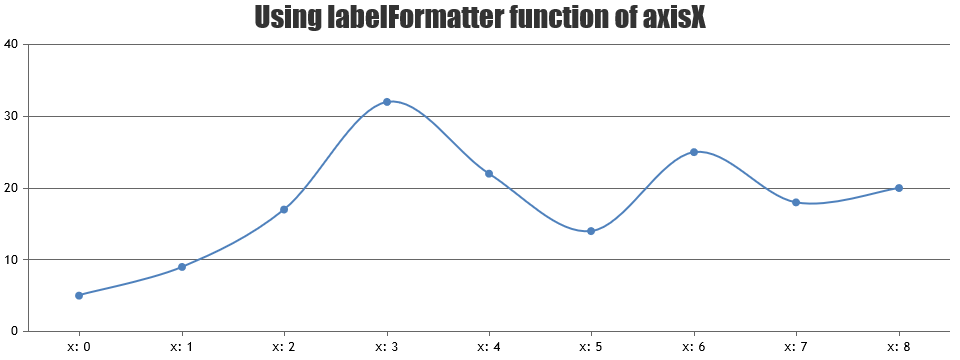
To format labels, you can use labelFormatter.
—
Vishwas R
Team CanvasJS