Login to Ask a Question or Reply
Home › Forums › Chart Support › Convert to date format › Reply To: Convert to date format
April 10, 2018 at 9:52 am
#20281
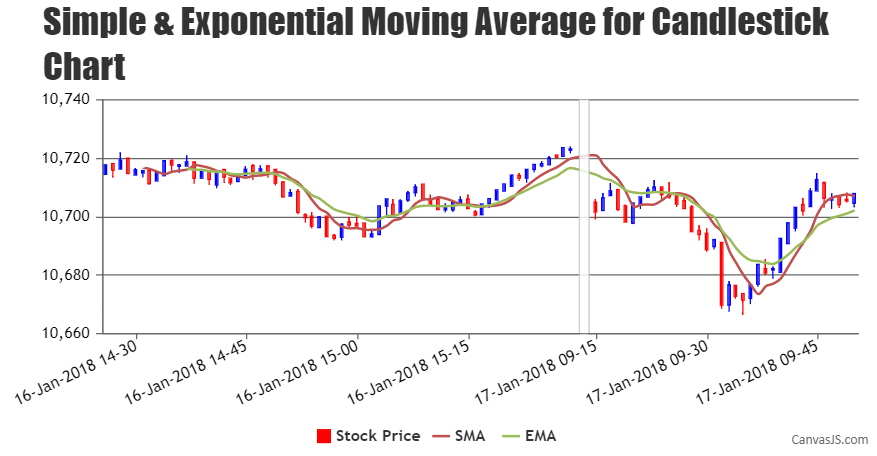
Axis labels are shown at every interval, which is auto-calculated such that the labels don’t overlap and make the chart look better. Labels are not shown for dataPoint but at every interval of axis. However, you can set the interval and intervalType to display the labels at a specific interval as shown in the code snippet below –
interval: 15,
intervalType: "minute",
Also, to shrink the region of axis on which dataPoints are not displayed you can use scaleBreaks as shown below –
scaleBreaks: {
  type: "straight",
    customBreaks: [{
      startValue: new Date(2018,00,16,15,30),
      endValue: new Date(2018,00,17,09,14)
    }]
},
Kindly take a look at this updated JSFiddle for an example.
___________
Indranil Deo
Team CanvasJS