@netpresent,
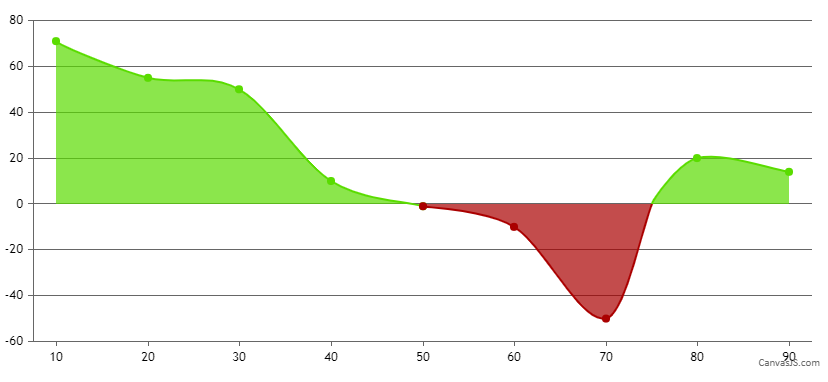
you can have different color for each region by setting the color property color: 'rgb(90, 220, 0)' for individual dataSeries and splitting the dataSeries based on positive or negative. Please take a look at this JSFiddle.
___________
Indranil Deo
Team CanvasJS