@rick2,
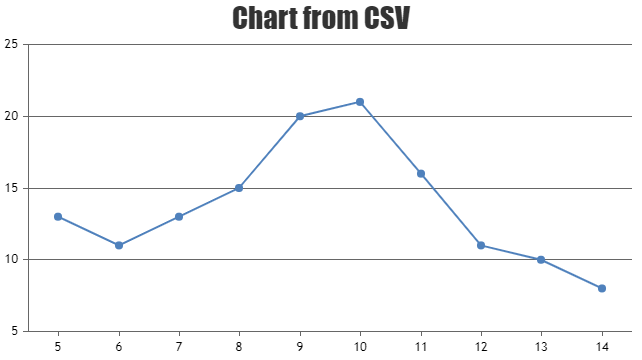
As x-value stored in CSV is data-time, it should be parsed to date object than to float x: parseFloat(points[0]),. Changing it to x: new Date(points[0]), should work fine in your case. Please take a look at this documentation page for step-to-step tutorial on rendering chart with data from CSV.

—
Vishwas R
Team CanvasJS