@nisha,
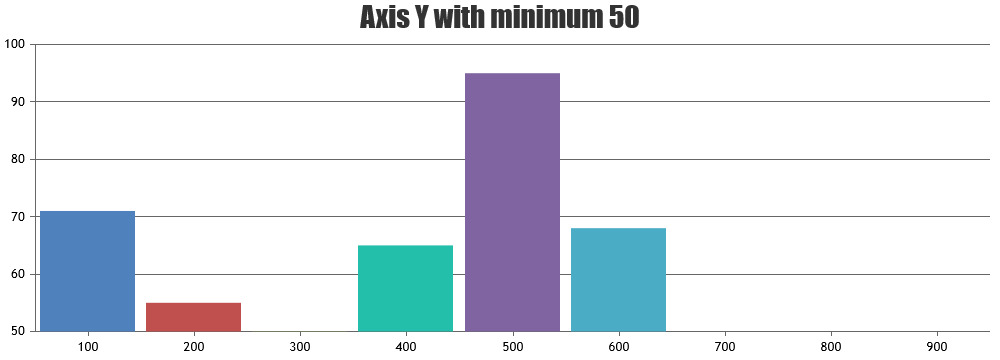
Please take a look at yValueFormatString for formatting y-values in the toolTip. Also, kindly refer axisX.minimum for setting a minimum value and axisX.interval for customizing the interval at which the axis labels are shown.

___
Suyash Singh
Team CanvasJS