Login to Ask a Question or Reply
Home › Forums › Chart Support › combining candlestick chart and line chart (moving average line) › Reply To: combining candlestick chart and line chart (moving average line)
February 2, 2018 at 11:36 am
#19285
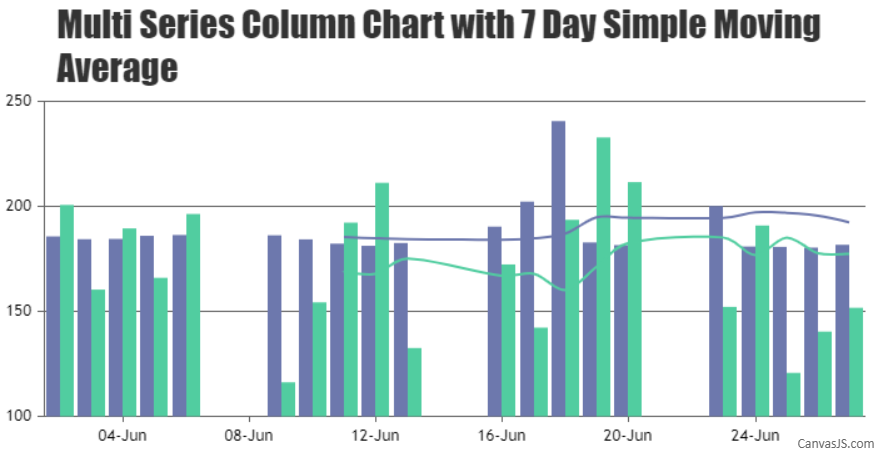
You can loop through each of the column series and create a corresponding series representing the Simple Moving Average as shown in the code snippet below –
// Pass all the data-series to render SMA
for(var i = 0; i < numberOfDataSeries; i++) {
    renderSimpleMovingAverage(chart.options.data[i], 7);
}

chart.render();

function renderSimpleMovingAverage(dataSeries, smaPeriod) {
    if(dataSeries.dataPoints.length <= smaPeriod) return;
    else {
    	// Add a new line series for Moving Averages
	chart.options.data.push({
            type: "spline",
            markerSize: 0,
	    color: dataSeries.color,
	    name: dataSeries.name + " SMA",
	    yValueFormatString: "#,##0.00",
	    dataPoints: []
	});

	var total;
	for(var i = smaPeriod; i < dataSeries.dataPoints.length; i++) {
	    total = 0;
	    for(var j = (i - smaPeriod); j < i; j++) {
	    total += dataSeries.dataPoints[j].y;
	    }
	    chart.options.data[chart.options.data.length - 1].dataPoints.push({
	    	x: dataSeries.dataPoints[i].x,
		y: total / smaPeriod
	    });
	}
    }
}
Please take a look at this JSFiddle.
___
Suyash Singh
Team CanvasJS