Login to Ask a Question or Reply
Home › Forums › Chart Support › Charts with drop down button to filter › Reply To: Charts with drop down button to filter
January 18, 2018 at 7:20 pm
#18895
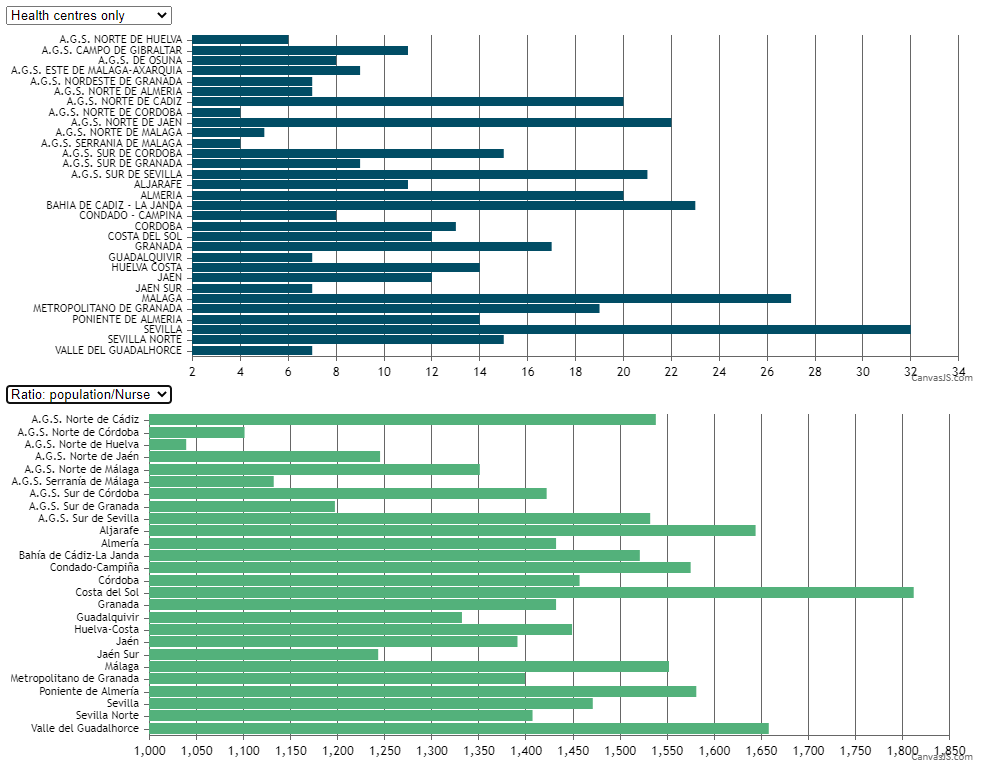
You just need to have separate charts for each dropdowns as shown in the code snippet below –
var dataPoints1 = [];
var chart1 = new CanvasJS.Chart("chartContainer1", {
	animationEnabled: true,
	axisX: {
		interval: 1,
		labelMaxWidth: 1000,
		labelFontSize:11,
		reversed: true
	},
	axisY2:{
		interlacedColor: "rgba(1,77,101,.2)",
		gridColor: "rgba(1,77,101,.1)",
		title: ""
	},

	data: [{
		type: 'bar',
		color: "#014D65",
		//xValueFormatString:"D MM h:mm",
		name: "series1",
		dataPoints: dataPoints1 // this should contain only specific serial number data

	}]
});

$( "#dd" ).change(function() {
	chart1.options.data[0].dataPoints = [];
	var e = document.getElementById("dd");
	var selected = e.options[e.selectedIndex].value;
	dps = jsonData1[selected];
	for(var i in dps) {
		chart1.options.data[0].dataPoints.push({label: dps[i].label, y: dps[i].y});
	}
	chart1.render();
});

var dataPoints2 = [];
var chart2 = new CanvasJS.Chart("chartContainer2", {
	animationEnabled: true,
	axisX: {
		interval: 1,
		labelMaxWidth: 1000,
		labelFontSize:11,
		reversed: true
	},
	axisY2:{
		interlacedColor: "rgba(1,77,101,.2)",
		gridColor: "rgba(1,77,101,.1)",
		title: ""
	},

	data: [{
		type: 'bar',
		color: "#53B17B",
		//xValueFormatString:"D MM h:mm",
		name: "series1",
		dataPoints: dataPoints2 // this should contain only specific serial number data

	}]
});

$( "#second" ).change(function() {
	chart2.options.data[0].dataPoints = [];
	var e = document.getElementById("second");
	var selected = e.options[e.selectedIndex].value;
	console.log(selected)
	dps = jsonData2[selected][0];
	for(var i in dps) {
		chart2.options.data[0].dataPoints.push({label: dps[i].label, y: dps[i].y});
	}
	chart2.render();
});
Please take a look at this updated jsfiddle.
—
Vishwas R
Team CanvasJS