Login to Ask a Question or Reply
Home › Forums › Chart Support › What if, all y : data is 0 ? › Reply To: What if, all y : data is 0 ?
December 8, 2017 at 11:11 am
#17889
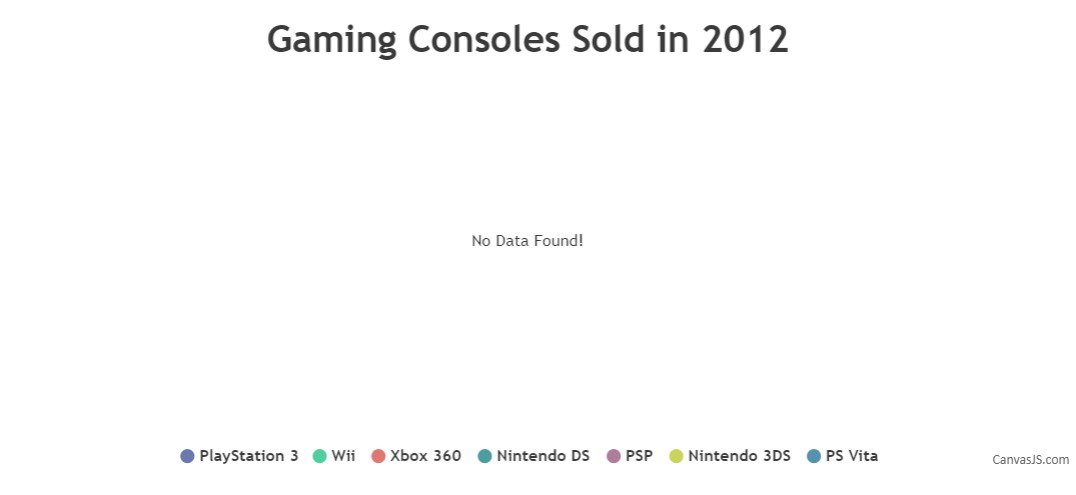
In cases like above in which all the dataPoints have y-values as 0 or null, you can add subtitles to the chart with a message like “No Data Found!” as shown below:
showDefaultText(chart, "No Data Found!");

function showDefaultText(chart, text){
  var dataPoints = chart.options.data[0].dataPoints;
  var isEmpty = !(dataPoints && dataPoints.length > 0);

  if(!isEmpty){
    for(var i = 0; i < dataPoints.length; i++){
      isEmpty = !dataPoints[i].y;
      if(!isEmpty)
        break;
    }
  }

  if(!chart.options.subtitles)
    chart.options.subtitles = [];
  if(isEmpty)
    chart.options.subtitles.push({
      text : text,
      verticalAlign : 'center',
    });
  else
    chart.options.subtitles = [];
}
Please take a look at this JSFiddle for a working example with sample code.

—
Sanjoy Debnath
Team CanvasJS