Login to Ask a Question or Reply
Home › Forums › Chart Support › Excluding Date on X Axis when no data › Reply To: Excluding Date on X Axis when no data
November 30, 2017 at 10:56 am
#17755
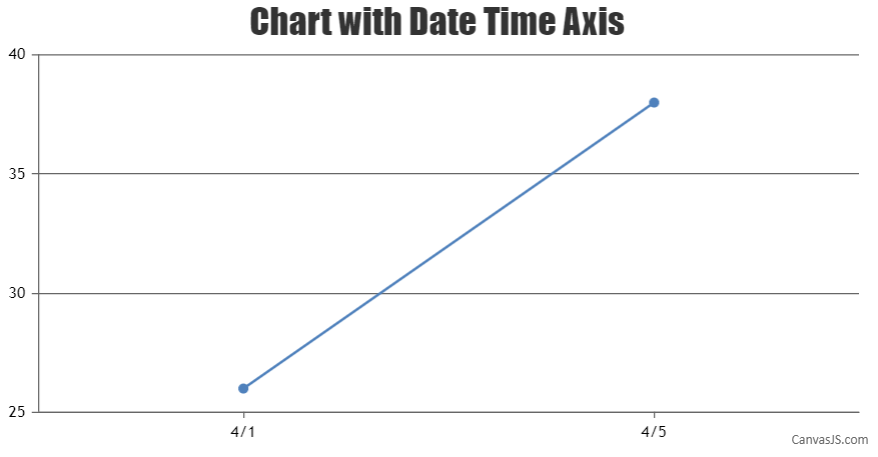
When we use the x-values for dataPoint, axis labels are not shown for dataPoint but at every interval of the axis. In your case, as you are trying to display axis label at specified dataPoint you can use label property in dataPoint instead of x-value as shown in the code snippet below –
[
  { label: CanvasJS.formatDate(new Date(2012, 03, 1),"M/D"), y: 26 },
  { label: CanvasJS.formatDate(new Date(2012, 03, 5),"M/D"), y: 38 }
]
Please take a look at this JSFiddle for a working example.
___________
Indranil Deo
Team CanvasJS