@fbk,
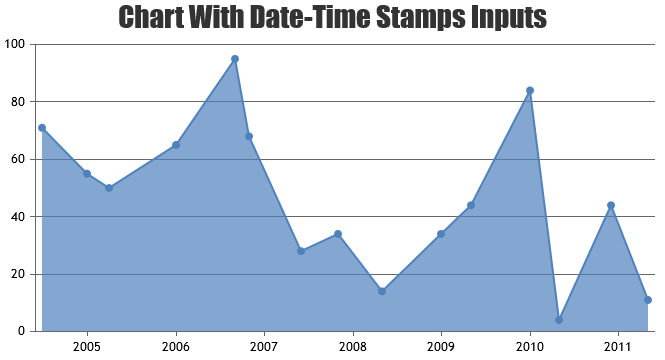
Kindly refer this JSFiddle for an example on creating chart with data from text file.
The format of data used in text file (dataPoints.txt):
10 20
15 25
20 15
25 33
30 9
35 15
40 20
Also refer to this documentation page for more information on using date-time values in axisX.

___
Suyash Singh
Team CanvasJS