Login to Ask a Question or Reply
Home › Forums › Chart Support › Set image as a marker › Reply To: Set image as a marker
April 3, 2017 at 4:35 pm
#14726
1. Default Markers are automatically disabled when number of dataPoints are more. You can manually override the automatic disabling/enabling of markers by setting markerSize to a value equal to or greater than zero.
{
  .
  .
  data: [{
    markerSize: 10,
    .
    .
  }]
}
Please have a look at this JSFiddle for complete code.
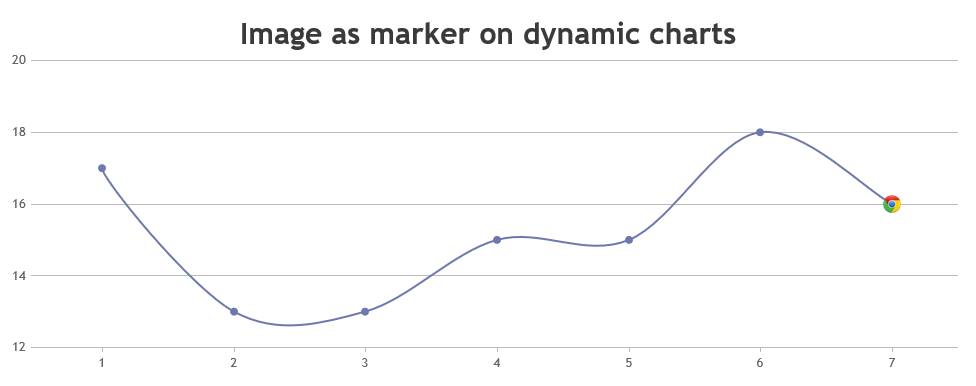
2. You can show the marker image only for current dataPoint by placing the marker Image on top of the last dataPoint every time the chart is updated. Please have a look at this below code snippet for the same.
var updateChart = function () {
  yVal = yVal + Math.round(5 + Math.random() * (-5 - 5));
  dps.push({ x: xVal,y: yVal });
  xVal++;
  if (dps.length > 10)
  {
    dps.shift();
  }
  chart.render();

  // Position image marker over the last/ current dataPoint
  positionMarkerImage(imageMarker, chart.options.data[0].dataPoints.length - 1);
};

function positionMarkerImage(imageMarker, index){
  var pixelX = chart.axisX[0].convertValueToPixel(chart.options.data[0].dataPoints[index].x);
  var pixelY = chart.axisY[0].convertValueToPixel(chart.options.data[0].dataPoints[index].y);

  imageMarker.css({"position": "absolute",
                   "display": "block",
                   "top": pixelY - imageMarker.height()/2,
                   "left": pixelX - imageMarker.width()/2
                  });
}

var updateId = setInterval(function () { updateChart();}, updateInterval);
Please refer to this JSFiddle for complete code on the same.
___
Suyash Singh
Team CanvasJS