Cristian,
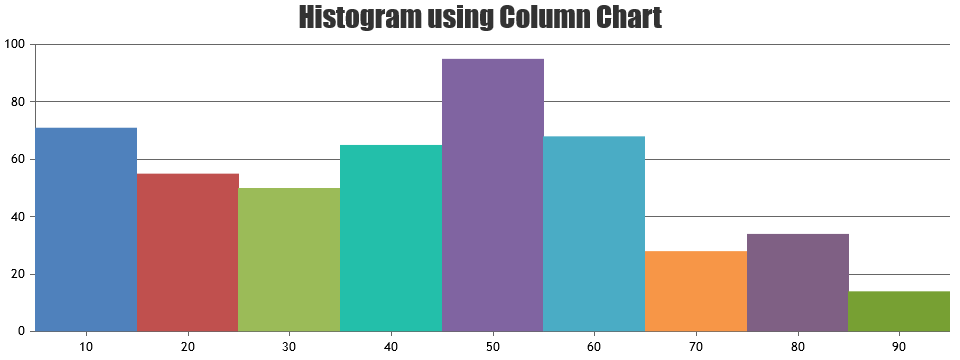
1) By setting dataPointWidth based on axis width and number of dataPoints in column chart, histogram chart can be rendered. Please check this JSFiddle.
2) You can remove left/right padding between column and axis by setting minimum/maximum.
—
Vishwas R
Team CanvasJS