Login to Ask a Question or Reply
Home › Forums › Chart Support › How to Re render with animation › Reply To: How to Re render with animation
March 13, 2017 at 11:38 am
#14558
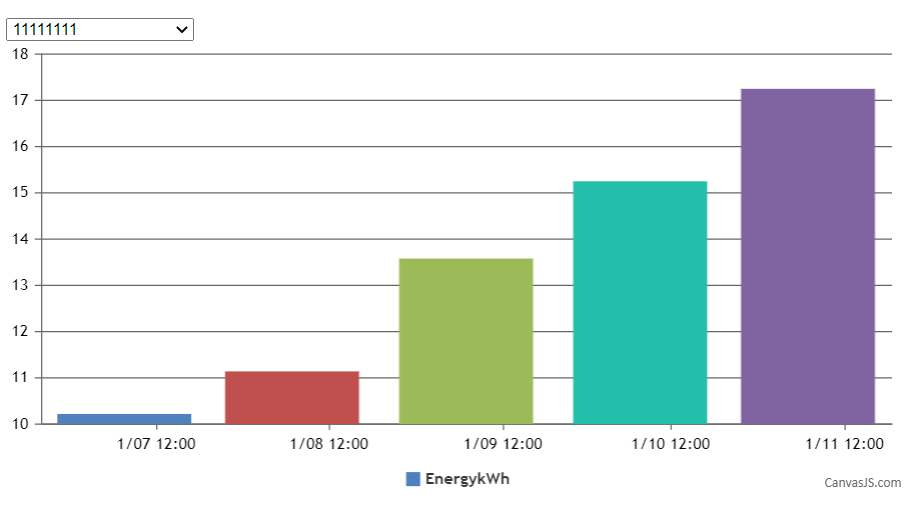
To render the chart each time with animation, you will need to create a new chart with updated options based on the value selected from dropdown. Code snippet below shows how you can achieve the same:
$( ".dropdown" ).change(function() {
  options.data[0].dataPoints = [];
  var e = document.getElementById("dropdownMenu");
  var selected = e.options[e.selectedIndex].value;
  dps = jsonData[selected];
  for(var i in dps) {
    var xVal = dps[i].x;
    options.data[0].dataPoints.push({x: new Date(xVal), y: dps[i].y});
  }
  (new CanvasJS.Chart("chartContainer", options)).render();
});
Please take a look at this JSFiddle for a working example with sample code.

—-
Bivek Singh
-
This reply was modified 8 years, 9 months ago by
Bivek Singh.
-
This reply was modified 4 years, 9 months ago by
Shashi Ranjan.
-
This reply was modified 4 years, 9 months ago by
Shashi Ranjan.