Akhil,
We observe that the labels are shown for every dataPoints.
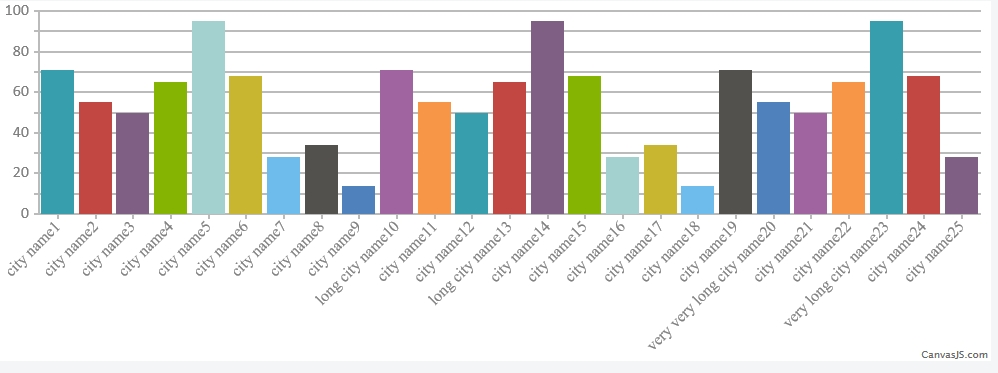
If there are more number of dataPoints, its better not to show every labels, which can be controlled by setting interval, and show few to make it look better or by increasing the chart width, labels get more space and can be shown better.
Suggestion: Compared to labelAngle: 90, setting it to -45 makes it much readable. Check this JSFiddle.
—
Vishwas R
Team CanvasJS