Login to Ask a Question or Reply
Home › Forums › Chart Support › Y-Axis Minimum,Maximum and Interval Manual Plotting › Reply To: Y-Axis Minimum,Maximum and Interval Manual Plotting
July 25, 2016 at 12:16 pm
#11603
Muralimnmcse,
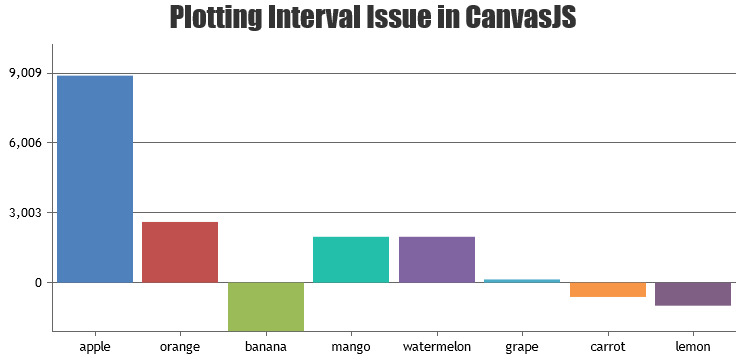
axisY is attributes of Chart options. But you seem to be passing axisY options to dataSeries instead of chart. Passing it inside chart-options should work fine in this case. Please find the code-snippet below.
var chart = new CanvasJS.Chart("chartContainer", {
  title:{
  text: "Plotting Interval Issue in CanvasJS"
  },
  axisY:{
    minimum: -2100,
    maximum: 10236,
    interval: 3003,
  },
  data: [
    {
    // Change type to "doughnut", "line", "splineArea", etc.
    type: "column",
      dataPoints: [
        { label: "apple", y: 8897.10 },
        { label: "orange", y: 2608.39 },
        { label: "banana", y: -2088.73 },
        { label: "mango", y: 1971.12 },
        { label: "watermelon", y: 1971.12 },
        { label: "grape", y: 138.52 },
        { label: "carrot", y: -615.21 },
        { label: "lemon", y: -991.10 }
      ]
    }
  ]
});

chart.render();
Please take a look at this JSFiddle for complete code.
—
Sanjoy