@mmfc
In the JSFiddle that you have shared, we observe that you are not providing x-values, because of which the date starts from Jan 1 1970 – as x-values are auto-assigned as 1,2,3,… internally. As the axis is dateTime axis, we suggest you to use intervalType along with interval to set the interval but to pass x-values.
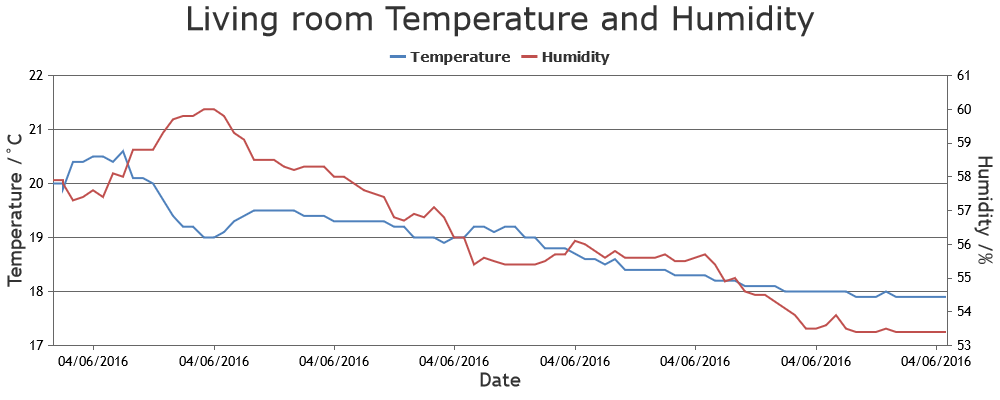
Here is the working fiddle with formatted-labels in “DD/MM/YYYY” format.
—
Vishwas R
Team CanvasJS