Andres,
We looked into your JSON data and labels are null because of which it is not showing in second, third and fourth chart. When label is null, chart shows x-axis value at that point.
Here is the JSON data used by your second chart :
[{"label":null,"y":1},{"label":null,"y":45},{"label":null,"y":85}]
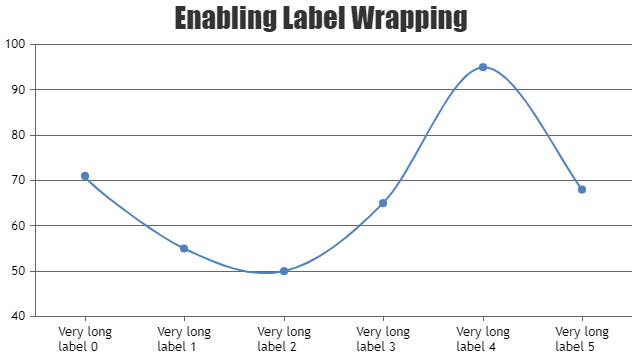
In case of fifth chart, labels are overlapping because they are very long. You can avoid the same by wrapping labels as shown in the documentation page.

__
Anjali