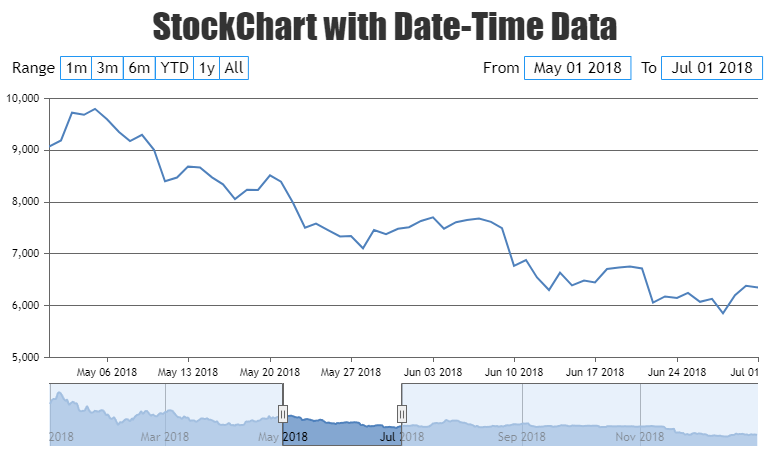
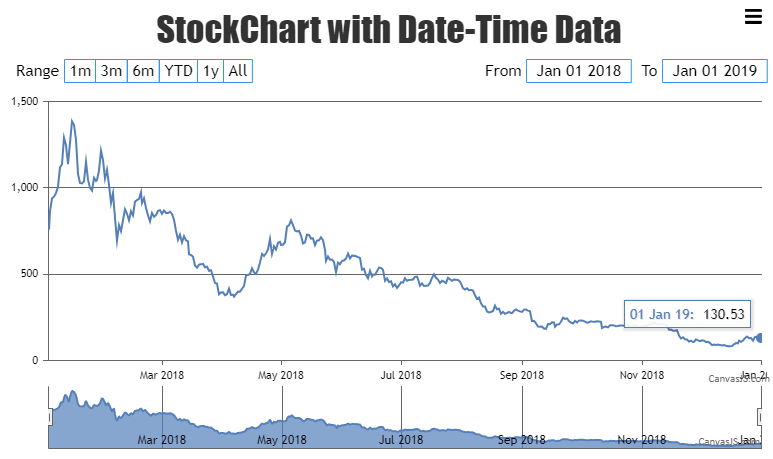
On the Web site, there is a demo (randomly chosen):
https://canvasjs.com/javascript-stockcharts/candlestick-stockchart-range-selector/
If you put the tooltip over the last OHLC box on the right hand side, the tooltip box displays:
30 Jun 18
Open: $453.29
High: $455.87
Low: $444.85
Close: $451.43
This is an error. The JSON file pointed to by the HTML page, on the server, has the following entry for 30 Jun 2018:
date: “2018-06-30”
open: 434.6
high: 462.49
low: 434.5
close: 453.29
This obviously does not correspond to the tooltip. However, the tooltip does correspond to the following date:
date: “2018-07-01”
open: 453.29
high: 455.87
low: 444.85
close: 451.43
A lot of the demos, and the software I am writing, all have this same problem.
The date in the tooltip box is off by one day.
Anyone know what I am doing wrong, or what is wrong with tooltip?
Thanks

