Login to Ask a Question or Reply
Home › Forums › StockChart Support › zoom into open-ended regions not working › Reply To: zoom into open-ended regions not working
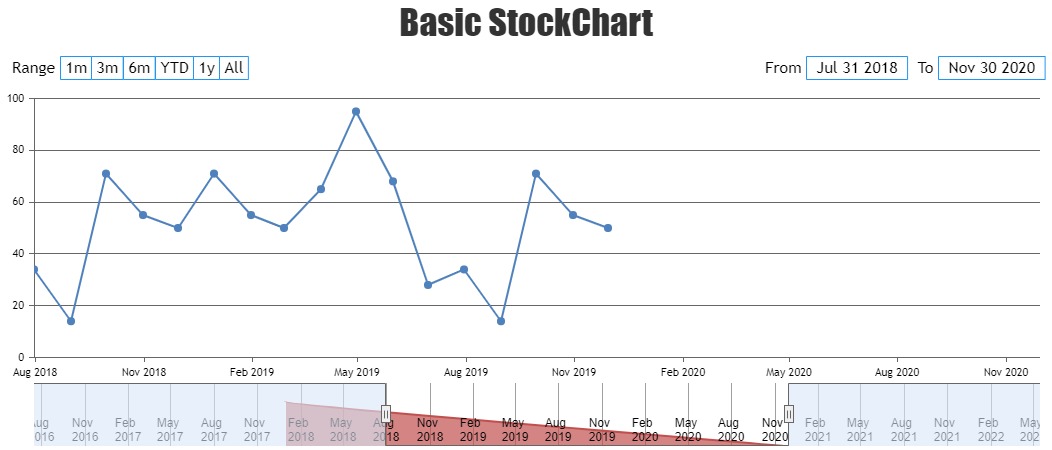
Zoom / Pan behavior is designed such that zooming is limited upto a certain region, so that user doesn’t end up zooming into a blank-region (region with no dataPoints). To zoom into a certain region, there should be a minimum of 3-4 dataPoints over the axis. Please refer to this forum thread for more information. Also, one can’t zoom outside the actual axis range (minimum & maximum). In your case, it’s getting cancelled as zooming happens outside the axis range. You can handle this by setting minimum and maximum of charts based on navigator.
stockChart.charts[0].axisX[0].set("minimum", stockChart.navigator.axisX[0].get("minimum"), false);
stockChart.charts[0].axisX[0].set("maximum", stockChart.navigator.axisX[0].get("maximum"));
Please take a look at this updated JSFiddle for working code.
—
Vishwas R
Team CanvasJS