Login to Ask a Question or Reply
You must be logged in to post your query.
Home › Forums › Chart Support › on Click Event I Want to Show Tooltip
on Click Event I Want to Show Tooltip
- This topic has 4 replies, 2 voices, and was last updated 4 years, 3 months ago by
Manoj Mohan.
-
April 8, 2022 at 8:32 pm #37369
Hello
I want to show tooltip Via Click Event.
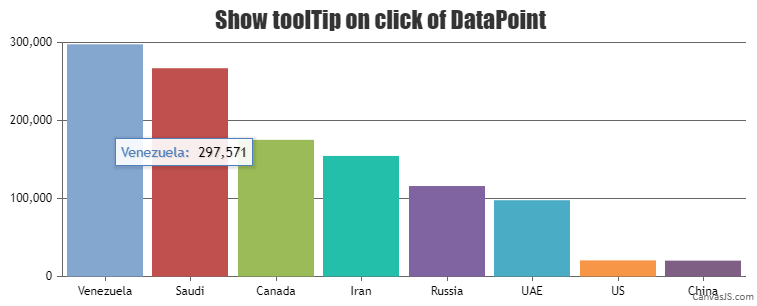
there were any Option for it ?April 11, 2022 at 8:11 pm #37386You can use tooltip’s showAtX method along with click event handler of dataSeries to show tooltip on clicking datapoint. Please check out the code snippet below.
var clicked = false;
  var chart = new CanvasJS.Chart("chartContainer",
                                 {
    title:{
      text: "Show toolTip on click of DataPoint"
    },

    toolTip: {
      updated: function(e) {
      	// hide tooltip if datapoint is not clicked
        if(!clicked)
          e.chart.toolTip.hide();
      }
    },
    data: [

      {
        click: showToolTipOnClick,
        mouseout: hideToolTip,
        dataPoints: [
          { x: 1, y: 297571, label: "Venezuela"},
          { x: 2, y: 267017,  label: "Saudi"},
          { x: 3, y: 175200,  label: "Canada"},
          { x: 4, y: 154580,  label: "Iran"},
          { x: 5, y: 116000,  label: "Russia"},
          { x: 6, y: 97800, label: "UAE"},
          { x: 7, y: 20682,  label: "US"},
          { x: 8, y: 20350,  label: "China"}
        ]
      }
    ]
  });

  chart.render();

  function showToolTipOnClick(e) {
    clicked = !clicked;
    clicked ? e.chart.toolTip.showAtX(e.dataPoint.x) : e.chart.toolTip.hide();
  }

  function hideToolTip(e) {
    clicked = false;
    e.chart.toolTip.hide()
  }
Also, please take a look at this JSFiddle for complete working code.
—-
Manoj Mohan
Team CanvasJSApril 13, 2022 at 6:01 pm #37395Hello @manoj-mohan
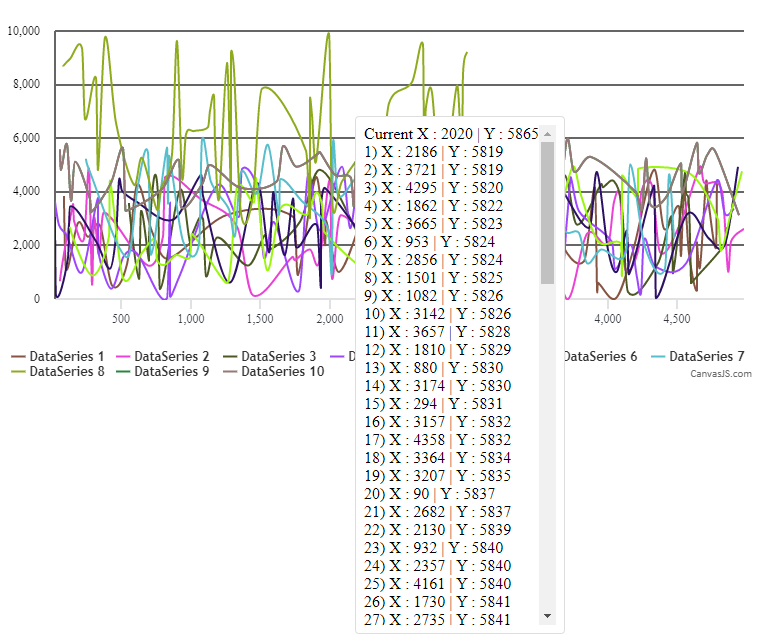
In My case i Have long tooltip than i want to Scroll but i when to there its getting hide and i want to Show and Hide tooltip by click Event only
Check Out MY JSFiddle
April 18, 2022 at 6:45 pm #37497We are looking into your query and get back to you at the earliest.
—-
Manoj Mohan
Team CanvasJSApril 19, 2022 at 7:11 pm #37510You can create a custom DOM for tooltip and show it on click of the dataPoint as shown in the code snippet below.
function showToolTipOnClick(e) {
    isDataPointClicked = true;
    if(dataPointShown !== e.dataPoint) {
      clicked = true;
      dataPointShown = e.dataPoint;
    } else {
      clicked = !clicked;
    }

    if(customToolTipDOM === null) {
      customToolTipDOM = document.createElement("div");
      e.chart.container.appendChild(customToolTipDOM);
      customToolTipDOM.style.display = "none";
      customToolTipDOM.style.position = "absolute";
      customToolTipDOM.style.background = "#fff";
      customToolTipDOM.style.border = "1px solid #dedede";
      customToolTipDOM.style.borderRadius = "4px";
      customToolTipDOM.style.padding = "8px";
      customToolTipDOM.style.top = "0px";
      customToolTipDOM.style.left = "0px";
    }

    if(clicked) {
      left = Math.round(e.chart.axisX[0].convertValueToPixel(e.dataPoint.x)) + 30;
      customToolTipDOM.style.left =   "0px";
      customToolTipDOM.style.top =  Math.round(e.chart.axisY[0].convertValueToPixel(e.dataPoint.y)) + "px";
      customToolTipDOM.innerHTML = e.dataPoint.toolTipData;
      customToolTipDOM.style.display = "block";


      if(left + customToolTipDOM.offsetWidth + 30 > e.chart.container.offsetWidth) {
        left = left - customToolTipDOM.offsetWidth - 30;
      }
      customToolTipDOM.style.left =  left + "px";

    } else {
      customToolTipDOM.style.display = "none";
    }

  }
  chart.container.addEventListener("click", function() {
    if(!isDataPointClicked && customToolTipDOM) {
      customToolTipDOM.style.display = "none";
      clicked = false;
    }
    isDataPointClicked = false;
  });
Also, check out this updated JSFiddle for showing toolTip on click of the dataPoint.
—-
Manoj Mohan
Team CanvasJS
You must be logged in to reply to this topic.